
FNB CORP/PA/ Leverages Diversified Services and Regional Footprint to Sustain Growth Amid Credit Sensitivities
FNB’s multi-state platform and comprehensive financial offerings underpin steady net income growth and liquidity resilience, while credit risk and economic shifts remain key challenges.
FNB Corp, a diversified financial services company headquartered in Pittsburgh, exhibits stable expansion through its extensive branch network across seven states and D.C., offering commercial banking, consumer banking, wealth management, and insurance. The firm reported net income growth of 21.5% in 2025 driven by higher net interest income and lower provisions. Its disciplined credit risk management and focus on deposit gathering enhance financial strength amid evolving market conditions. Capital allocation emphasizes moderate buybacks complemented by consistent dividend payouts. Going forward, growth catalysts include mortgage lending innovations and digital banking enhancements, while credit quality and macroeconomic factors present primary risks.
Company Overview
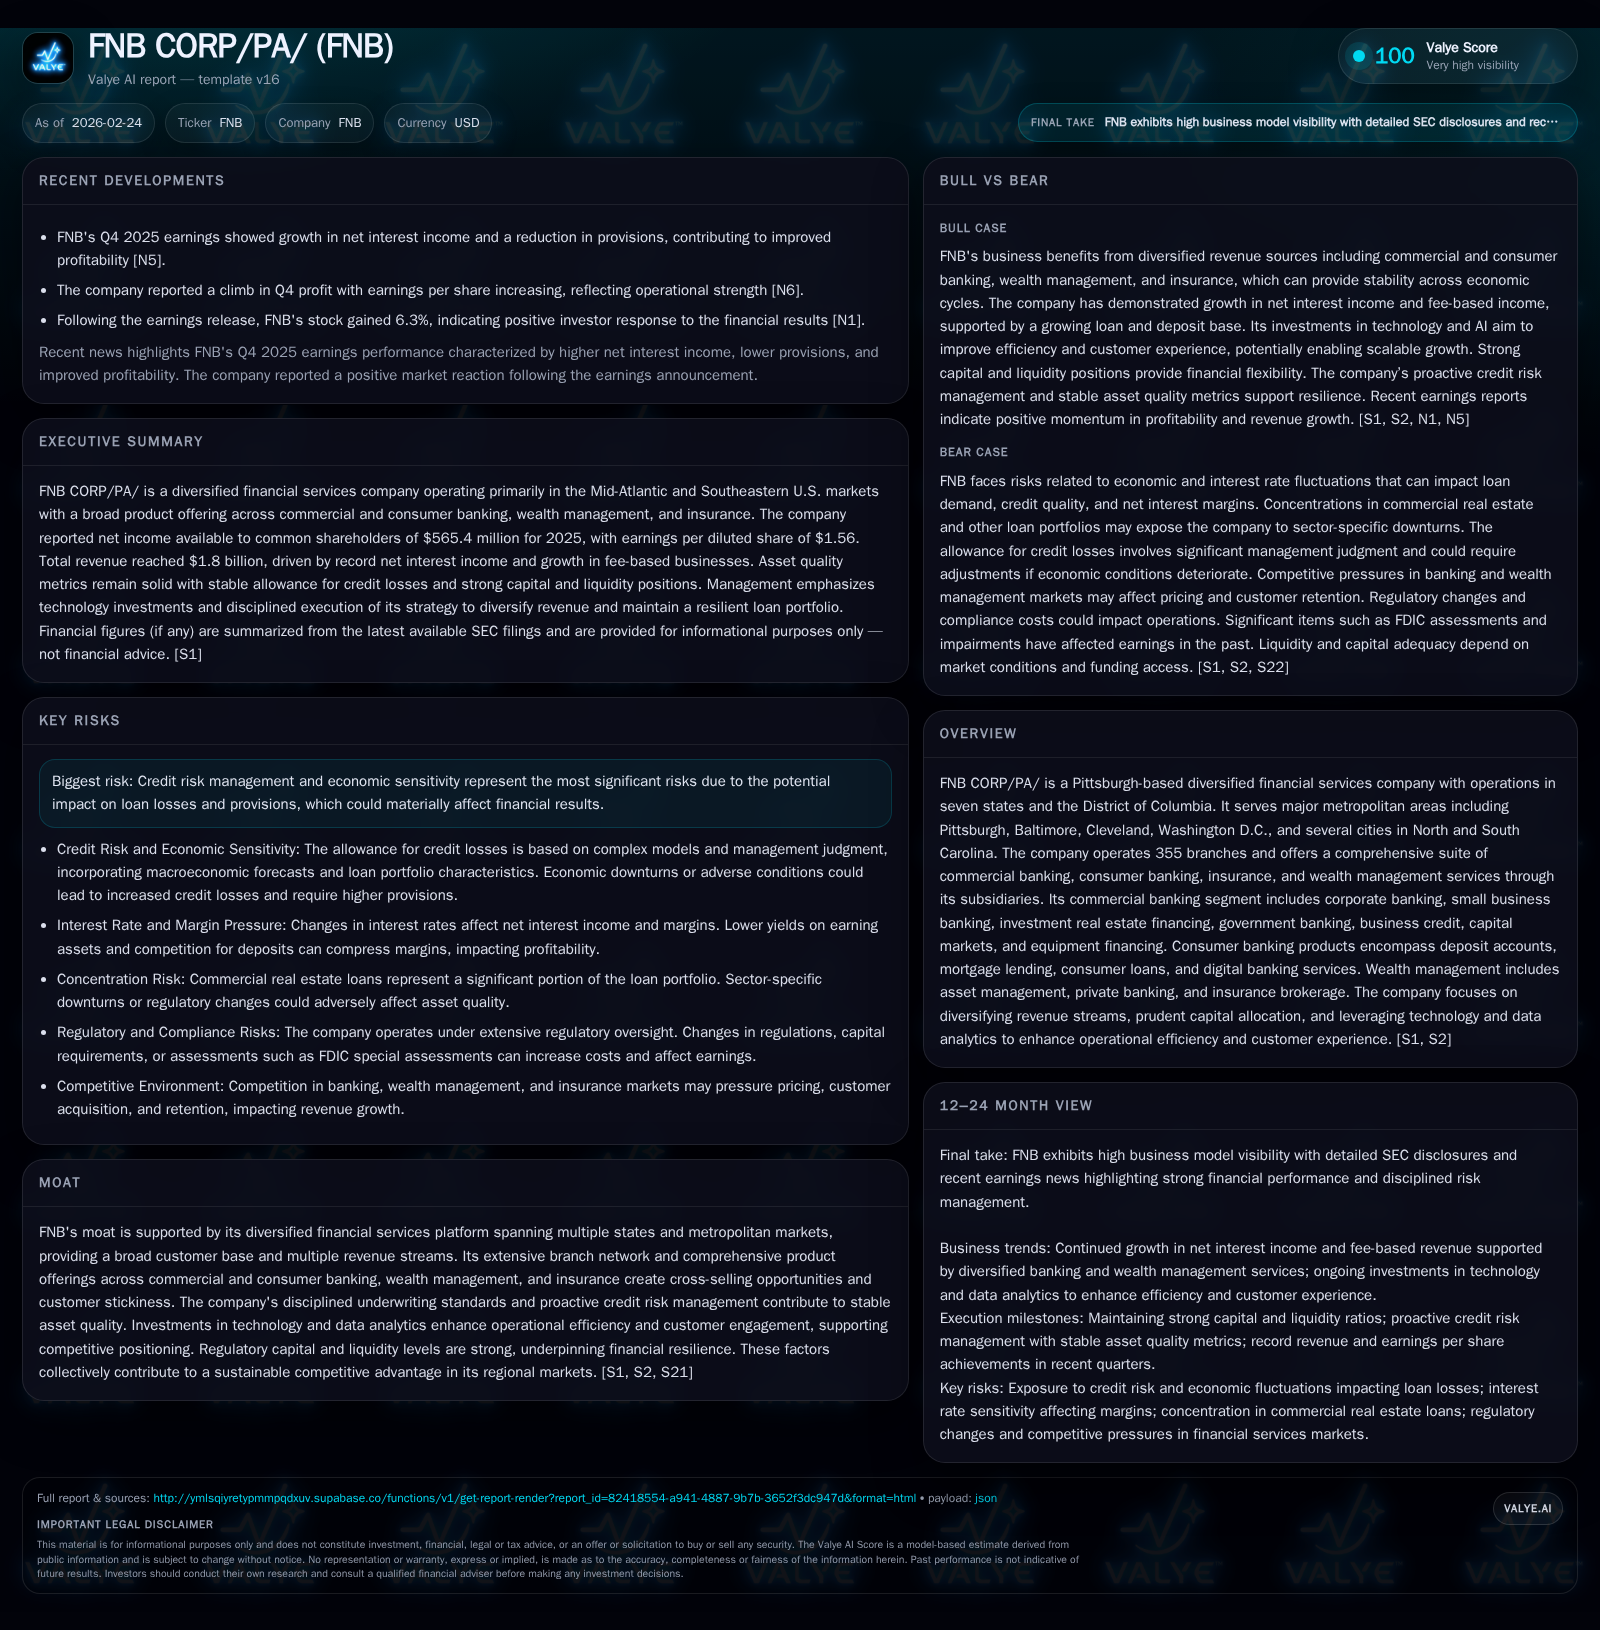
FNB CORP/PA/ is a Pittsburgh-based diversified financial services company with operations spanning seven states plus the District of Columbia. Its footprint encompasses major metropolitan markets such as Pittsburgh, Baltimore, Cleveland, Washington D.C., along with multiple nodes in North and South Carolina.
Operating through a network of approximately 355 branches, FNB offers a broad spectrum of financial products encompassing commercial banking (retail/business), consumer banking (deposits, mortgages, loans), wealth management (asset management, private banking), and insurance brokerage services [S1][S25]. This diversified platform supports multiple revenue streams across varied geographic markets.
Historical Performance
FNB’s net income demonstrated significant improvement in recent years with a notable acceleration from $465 million in FY2024 to $565 million in FY2025—a robust annual increase of roughly 21.5% [F1]. Operating earnings per share also expanded commensurately as core business drivers benefited from favorable interest rate dynamics and improved credit metrics.
Loan growth has been modest but positive at 2.5% for the same period driven mainly by consumer loan origination increases—a pronounced increase seen in residential mortgages (+11.2%) and consumer lines of credit (+11.1%) [S28]. Meanwhile, commercial real estate loans showed a slight contraction reflective of selective underwriting post-pandemic adjustments.
Total deposits exhibited solid expansion rising by approximately 4.5%, bolstered substantially by relationship-driven strategies that increased both interest-bearing demand deposits and non-interest-bearing deposits while savings balances declined slightly [S4][S13][S14]. Deposit insurance coverage remained steady around 77%, underscoring depositor confidence.
Operating cash flow declined to $482 million from $642 million in the prior year (-25%) while capital expenditures contracted moderately by roughly 24%, signaling disciplined cost controls alongside ongoing investments in technology infrastructure [F1].
Historical performance (annual)
| FY | Net ($mm) | CFO ($mm) | Capex ($mm) | Net YoY |
|---|---|---|---|---|
| 2025 | 565 | 482 | 106 | +21.5% |
| 2024 | 465 | 642 | 139 | -4.1% |
| 2023 | 485 | 423 | 88 | +10.5% |
| 2022 | 439 | 1218 | 95 |
Note: Omitted columns lack sufficient annual XBRL coverage in the provided tags (need ≥2 annual points): Rev, OpInc, Div. Source: SEC companyfacts cache [F1].
Capital returns and efficiency (annual)
| FY | Buybacks ($mm) | FCF ($mm) | ROE% |
|---|---|---|---|
| 2025 | 50 | 376 | 8.4 |
| 2024 | 3 | 503 | 7.4 |
| 2023 | 36 | 335 | 8.0 |
| 2022 | 43 | 1123 | 7.8 |
Source: SEC companyfacts cache [F1].
Note: Revenue or operating income not disclosed.
Strategic Growth Drivers & Challenges
A pivotal catalyst for FNB’s sustained growth is its investment in digital transformation initiatives aimed at enhancing customer engagement across both commercial and retail segments through mobile/online platforms and data analytics-driven lead generation [S4][S14]. This enhances cross-selling of products including mortgage loans under programs like Physicians First—a suite targeting medical professionals with specialized bundled solutions that have contributed to the uptick in residential mortgage originations [S24][N7]
Expansion within core regional markets coupled with penetration into affluent metro areas strengthens client diversity while minimizing concentration risk given the balanced mix of retail deposits and diversified commercial loan portfolios spread over industries without any individual sector exceeding 10% exposure [S28][S24].
However, headwinds remain from potential credit quality deterioration given sensitivity to macroeconomic cycles affecting commercial real estate valuations especially office properties outside downtown cores [S24], as well as broader economic uncertainties linked to tariffs impacting certain business clients' performance [S28][S15]. Proactive credit risk management policies—including stringent underwriting standards and allowance for credit losses calibrated against R&S macroeconomic forecasts—mitigate downside but warrant close monitoring going forward [S1][S17][S29].
Capital Structure & Liquidity Profile
FNB maintains a well-capitalized balance sheet supported by regulatory capital buffers compliant with federal banking agency requirements ensuring continued operational flexibility for growth investments or shareholder returns [S20][S27]. Stockholders’ equity increased steadily year-over-year hitting around $6.76 billion at end-2025 which corresponds to an approximate ROE of 8.4%, indicative of stable profitability relative to equity base [F1].
Liquidity remains a strong point with total deposits approximating nearly $40 billion as of late-2025 fueled by successful deposit gathering strategies targeting low-cost transaction accounts—non-interest-bearing demand accounts constitute about a quarter of total deposits—a favorable composition from a margin perspective [S4][S9]. Excess liquidity measured via cash plus salable unpledged government securities expanded to over $3.3 billion or roughly 6.5% of total assets—well above policy minimums—offering substantial buffer against volatility or funding stress scenarios as validated through periodic liquidity stress tests overseen by ALCO [S9][S21].
The loan-to-deposit ratio at approximately 89.7% reflects conservative balance sheet usage aligning asset growth with funding availability minimizing liquidity risk while providing room for further loan originations without aggressive wholesale funding reliance [S4][S16]. Also notable is improved wholesale credit facility availability at about $18 billion enhancing contingency funding options beyond core customer deposits [S9][S23].
Capital Deployment & Shareholder Returns
Capital allocation demonstrates an opportunistic approach balancing reinvestment alongside shareholder returns via dividends and buybacks without undermining capital adequacy targets or liquidity needs.
Annual share repurchases amounted to around $50 million in FY2025 compared to minimal activity during FY2024; total repurchases since program inception are meaningful highlighting management’s patience to deploy capital opportunistically depending on market pricing while continuing dividend payouts—though specific dividend amounts were not disclosed—reflecting commitment to shareholder distributions within regulatory frameworks applicable to banking institutions [F1][S20].
Forward-Looking Considerations & Milestones To Watch
Explicit forward guidance is limited; however, investor communications suggest a focus on sustaining net interest income growth supported by strategic loan portfolio mix optimizations and elevated deposit balances contributing stable funding cost advantages [N5][N13]. Key milestones include:
- Monitoring quarterly earnings for trends in net interest margin compression or expansion tied closely to rate environment movements,
- Credit loss provisions trends serving as leading indicator for asset quality stability,
- Expansion progress in mortgage origination programs especially through digital channels leveraging analytics,
- Regulatory capital ratios adherence amid organic balance sheet growth,
- Progress on technology investments fostering efficiency ratios improvement.
Sector Context Analysis
Regional banks like FNB operate amid competitive pressures necessitating diversification across service lines to generate fee income dilution against net interest margin pressures inherent in traditional deposit-taking lending models. FNB's strategy aligns well with peer group trends emphasizing technology-led customer acquisition/retention tools alongside granular deposit profile management targeting sticky transaction accounts beneficial for low deposit betas. Maintaining disciplined underwriting standards remains paramount given the uneven recovery trajectory impacting CRE sectors which historically experience higher loss severities during downturns.
Conclusion
FNB CORP/PA/'s performance over recent years illustrates the strength derived from its diversified multi-state geographic reach combined with comprehensive financial service offerings that reduce reliance on any single revenue source or market segment. The company’s prudent credit risk framework paired with robust liquidity profiles position it well within an uncertain macroeconomic backdrop; yet cautious oversight continues given sector sensitivities particularly tied to commercial real estate concentrations and evolving economic conditions. Capital management reflects balanced prioritization between growth funding stability and returning capital responsibly via dividends and buybacks according to market conditions. Ongoing innovations in mortgage lending tailored digital servicing capabilities reinforce medium-term growth promise. Investors ought to track evolving credit provisioning patterns alongside deposit gathering effectiveness as bellwethers for maintaining financial resilience going forward.
This analysis is based on publicly available information including recent SEC filings dated through February 2026 and news reports as cited. It does not provide investment advice or recommendations.
Disclaimer: This is research-only, informational analysis and not investment advice. It may include AI-generated interpretation and general industry context. Always verify important details using primary sources.
Comments