
Fidelity National Financial’s 2025 Earnings Highlight Revenue Growth and Capital Return Amid Profitability Headwinds
The company advanced top-line growth and maintained robust cash flows, while profitability contracted sharply due to market and operational factors.
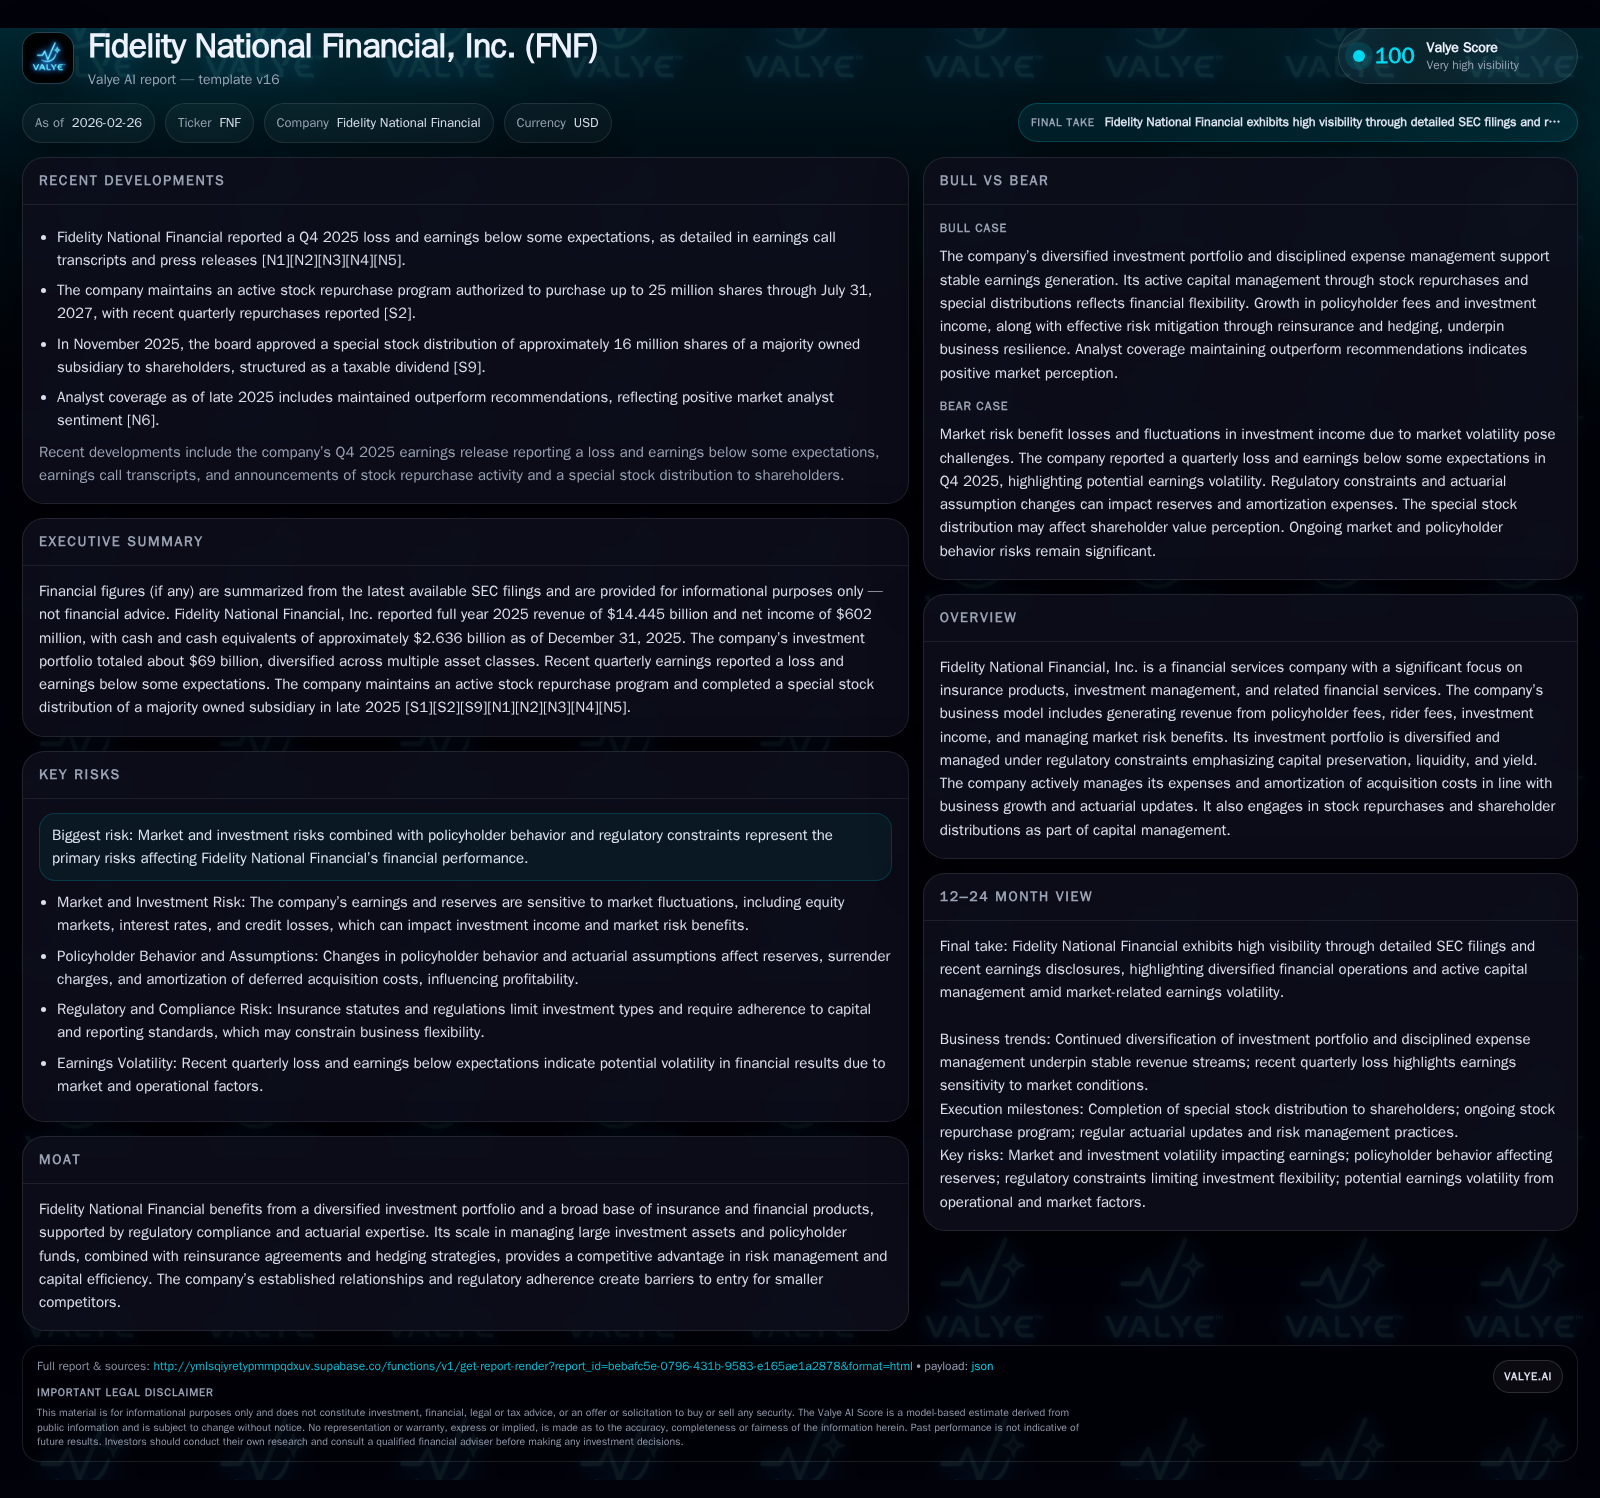
Fidelity National Financial, Inc. generated $14.45 billion in revenue for 2025, up 5.6% year-over-year, reflecting growth in insurance fees and investment income. Despite this, net income declined by over 50% from the previous year, pressured by recognized losses on investments and derivatives. Operating cash flow remains strong at $5.83 billion after a slight decline, supporting a stable dividend payment and modest share repurchases. The company’s capital allocation includes a notable special stock distribution of F&G Annuities & Life shares completed in December 2025. Regulatory adherence and actuarial expertise support competitive moat but risks from interest rates, equity volatility, and policyholder behavior persist.
Company Overview and Business Model
Fidelity National Financial, Inc. (FNF) operates predominantly as a financial services entity with significant emphasis on insurance products including title insurance, annuities, and investment management services [N1][S1]. The company generates revenues from policyholder fees (notably guaranteed minimum withdrawal benefit rider fees), cost of insurance charges on indexed universal life policies, investment income from a diversified portfolio, and other related financial services revenues [S1]. Capital preservation and liquidity are prioritized in portfolio management under stringent regulatory oversight.
Historical Performance Drivers
Over the last four years leading to FY2025, FNF exhibited consistent revenue expansion supported by both core insurance product growth and enhanced investment returns. Revenues increased from approximately $11.56 billion in 2022 to $14.45 billion in 2025 representing a compound growth trajectory driven largely by the expansion in rider fees linked to guaranteed minimum withdrawal benefits (GMWB) and escalations in mortgage loan yields during rising rates [F1][S1].
Notably, investment income—spanning fixed maturity securities, mortgage loans, limited partnerships, and other instruments—grew steadily reaching roughly $2.84 billion net of investment expenses in 2025 [S1]. However, the company incurred net realized and unrealized losses on its fixed maturity available-for-sale securities as well as unfavorable fair value adjustments on reinsurance embedded derivatives reflecting exposure to market risks [S1]. These factors together caused a significant contraction in net income despite rising top-line results.
Historical performance (annual)
| FY | Rev ($bn) | Net ($mm) | CFO ($bn) | Rev YoY | Net YoY |
|---|---|---|---|---|---|
| 2025 | 14.4 | 602 | 5.8 | +5.6% | -52.6% |
| 2024 | 13.7 | 1270 | 6.8 | +16.4% | +145.6% |
| 2023 | 11.8 | 517 | 6.5 | +1.7% | -54.5% |
| 2022 | 11.6 | 1136 | 4.4 |
Source: SEC companyfacts cache [F1].
Capital returns and efficiency (annual)
| FY | Div ($mm) | Buybacks ($mm) | ROE% |
|---|---|---|---|
| 2025 | 546 | 251 | 8.1 |
| 2024 | 532 | 0 | 16.4 |
| 2023 | 500 | 6 | 7.5 |
| 2022 | 489 | 553 | 20.2 |
Source: SEC companyfacts cache [F1].
(Source: [F1])
Profitability and Cash Flow Analysis
The sharp decline in profitability during FY2025—net earnings halving from the prior year—is attributable primarily to recognized net losses of $45 million on securities combined with substantial adverse changes in allowance for credit losses and derivatives fair value adjustments totaling over $100 million negatively impacting earnings [S1]. Despite this profit pressure, operating cash flow remains robust at $5.83 billion providing solid internal funding capacity.
Return on equity based on reported equity of approximately $7.42 billion was estimated near an annualized rate of ~8% in FY2025—down materially from prior periods but reflective of elevated earnings volatility associated with complex financial instruments embedded within the business [F1].
The working capital position remains strong with over $2.6 billion held in cash and equivalents providing liquidity buffers against market disruptions or regulatory capital calls [F1].
Capital Allocation Priorities
In terms of capital management during FY2025, Fidelity National Financial continued steady dividend distributions increasing slightly year-over-year to $546 million indicating commitment to shareholder returns even amid fluctuating profitability [F1][S4][S5]. Share repurchases resumed significantly after hiatus with $251 million spent on buybacks supported by available cash flows and normalized capital structure targets.
A notable corporate event during late-2025 was the approval and execution of a special stock distribution transferring about six shares of majority-owned subsidiary F&G Annuities & Life common stock per hundred shares held by FNF shareholders occurring on December 31, effectively distributing approximately 16 million F&G shares representing roughly one eighth of that entity’s outstanding stock [S6][S9][N3]. This move was structured as a taxable dividend augmenting overall shareholder value while also realigning corporate ownership structures.
Financial leverage has been conservatively managed with long-term debt totaling approximately $4.4 billion as fixed-rate instruments providing interest cost stability amid potential rate fluctuations; no floating rate debt is present reducing expense volatility related to benchmark changes [S1][S7].
Future Growth Outlook Indicators
Growth prospects hinge primarily on continued expansion of GMWB rider fee revenues linked to policy benefit bases remaining sizeable despite industry headwinds around low-interest rate environments or regulatory changes impacting product features [N2][S1]. Increasing mortgage loan portfolios further contribute incremental investment yield enhancement.
However, downside risks include potential declines in real estate activity reducing title insurance volumes—the company’s legacy business—as well as sustained market volatility impairing invested asset performance [S1]. Moreover, fluctuations in policyholder behavior such as early surrenders could influence unearned revenue liabilities materially.
Management commentary during recent earnings calls emphasizes close monitoring of reserve adequacy and active risk mitigation through reinsurance arrangements plus dynamic hedging strategies designed to neutralize embedded option exposures embedded within guaranteed products [N1][N2].
From an industry context standpoint (analysis), heightened regulatory scrutiny continues shaping product design particularly in indexed universal life sectors given consumer protection focus driving ongoing product innovation demands.
Competitive Positioning & Moat Elements
Firmly established relationships with mortgage lenders coupled with actuarial expertise afford Fidelity National competitive advantages difficult for smaller players to replicate quickly due to scale requirements and licensing barriers nationally [N1][S1]. The broad diversification across insurance products plus disciplined investment portfolio management strengthen resilience against macroeconomic cycles.
A layered approach combining reinsurance treaties with funds withheld provisions mitigates balance sheet concentrations while hedging offsets market sensitivities arising from guarantees embedded within annuity contracts maintaining capital efficiency metrics [S1]. This holistic risk-return calibration underpins the firm’s moat although external shocks can prompt episodic earnings pressures.
What to Watch Next (Analysis)
Absent explicit forward guidance disclosed publicly within filings or recent earnings transcripts beyond general remarks about cautious optimism for fee income trajectory and controlled expense management [N1], focus should remain on:
- Quarterly net income trends vis-à-vis realized investment gains/losses reflecting market volatility dynamics;
- Movements in unearned revenue liabilities relating to policyholder activity;
- Progress on any additional capital return initiatives or amendments to share repurchase authorizations;
- Regulatory updates affecting product offerings or capital requirements.
Any material changes within these vectors will influence fidelity’s near-term earnings stability given high sensitivity embedded in assumed actuarial parameters underlying their insurance contracts.
Disclaimer: This report is an informational analysis based solely upon publicly available data compiled from SEC filings and reputable financial news sources without any endorsement or investment opinion regarding Fidelity National Financial’s securities or operations.
Disclaimer: This is research-only, informational analysis and not investment advice. It may include AI-generated interpretation and general industry context. Always verify important details using primary sources.
Comments