
FTAI Aviation Expands Asset-Light Leasing via Strategic Capital Initiative While Managing High Leverage
FTAI Aviation's Q1 2026 results highlight ongoing execution of its proprietary MRE engine maintenance platform and innovative leasing strategy backed by robust capital markets financing.
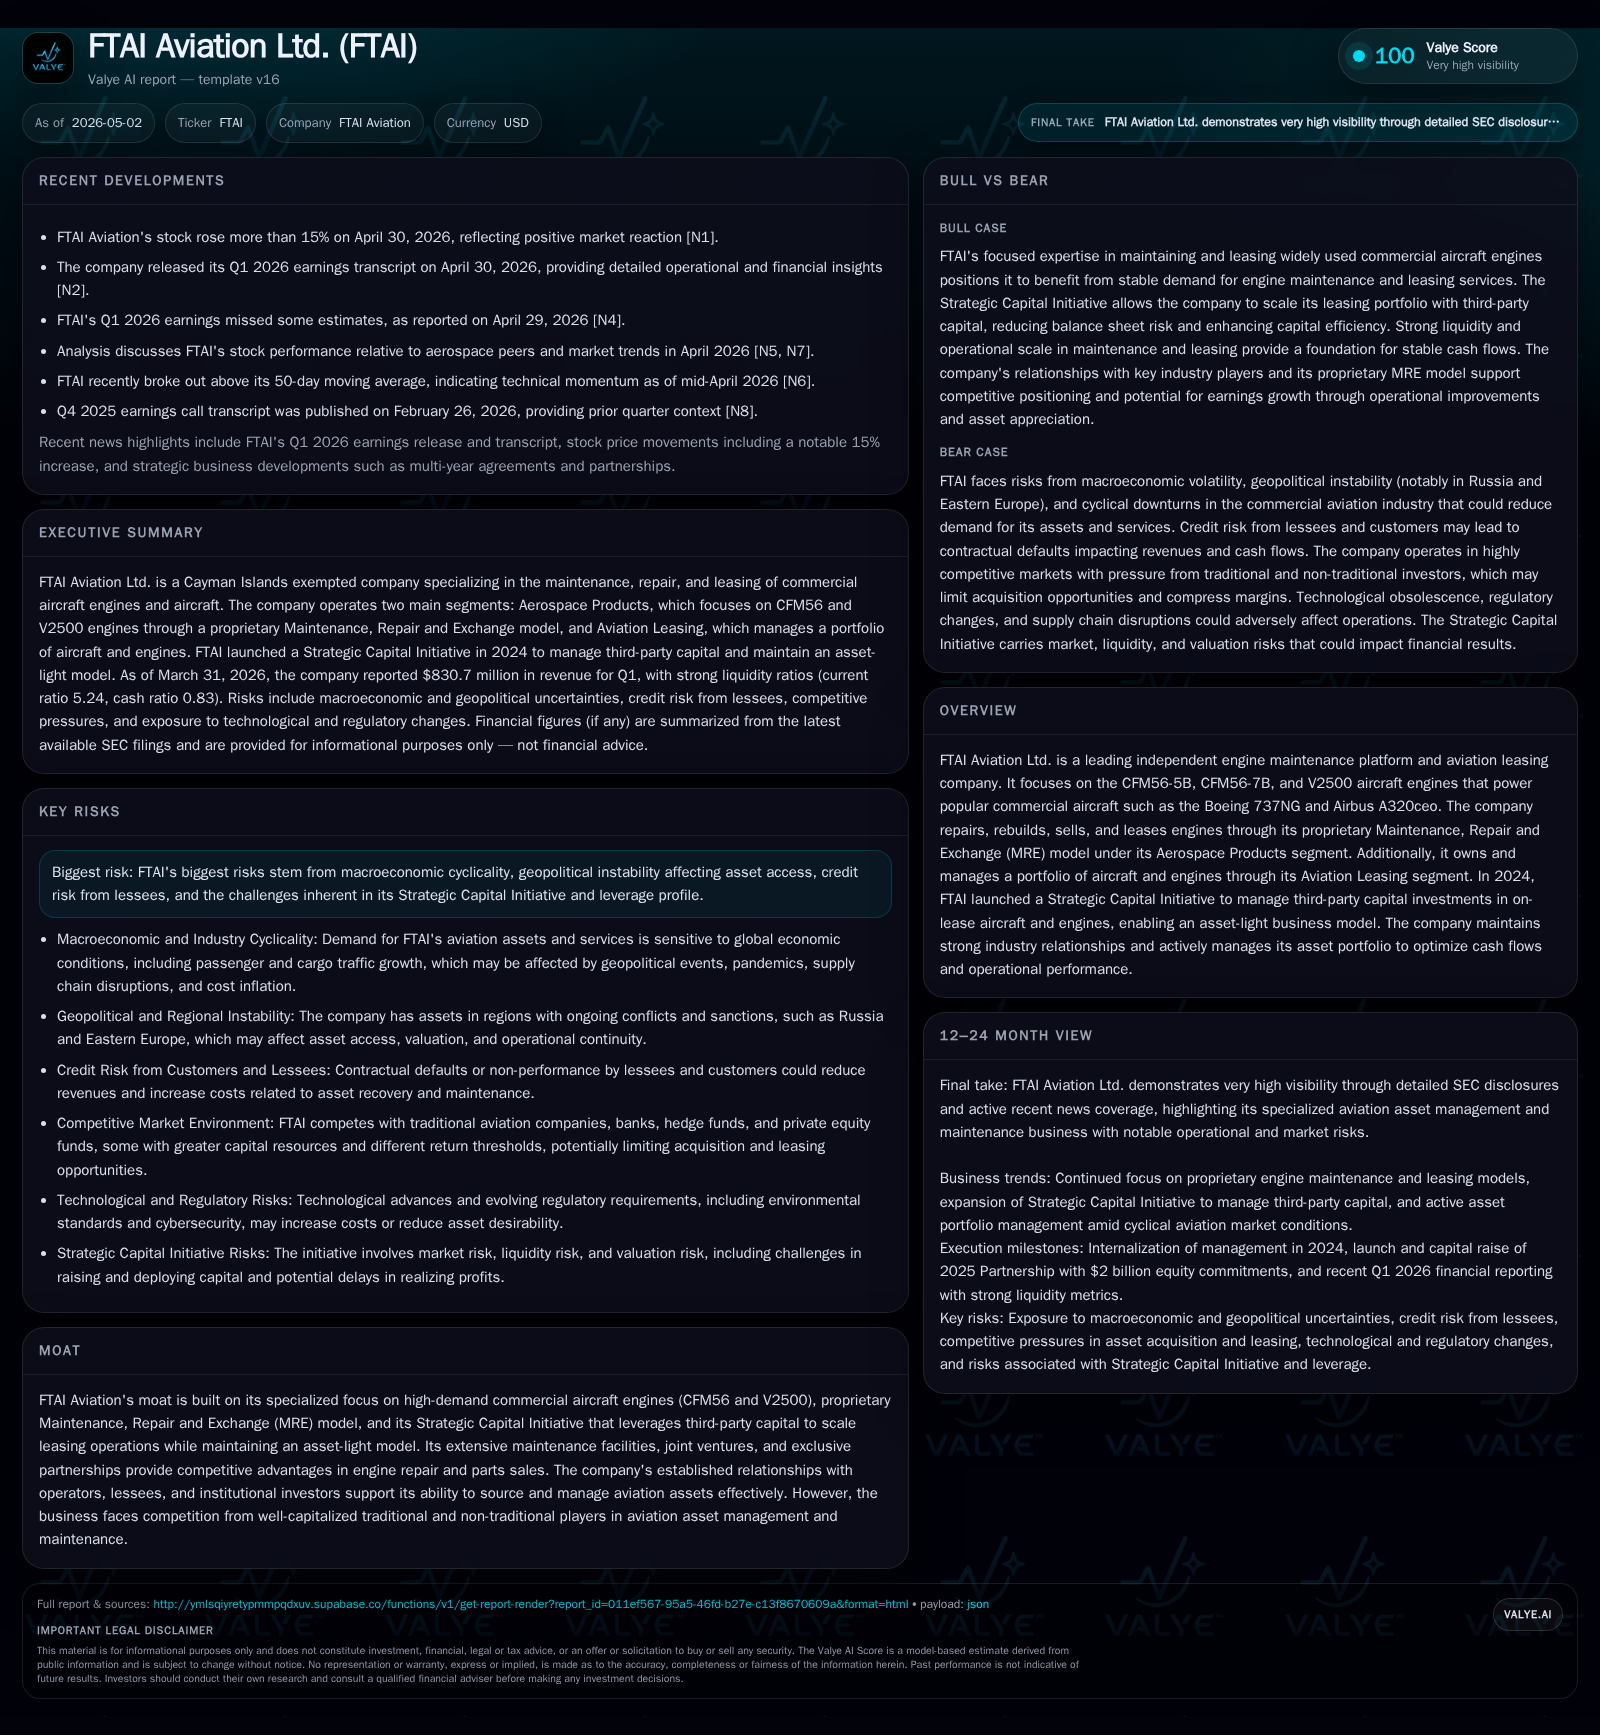
In the latest quarter ended March 31, 2026, FTAI Aviation Ltd. continues to execute its dual business model combining aerospace products and aviation leasing, anchored by a proprietary Maintenance, Repair and Exchange (MRE) platform for high-demand engines. The company’s Strategic Capital Initiative, launched in late 2024, drives a shift toward an asset-light model that leverages third-party institutional capital to scale narrowbody aircraft leasing operations. Despite a significant debt load exceeding $3.4 billion, FTAI exhibits strong liquidity with a current ratio above 5x and access to a revolving credit facility extending to 2031. Key growth drivers include global narrowbody fleet demand and engine aftermarket services underpinned by durable pricing power, though macroeconomic cyclicality and geopolitical risks remain material constraints.
Recent Operating Update
FTAI Aviation Ltd.'s first quarter ending March 31, 2026, as reported in the May 1 SEC Form 10-Q [S2], reveals steady operational execution of its aerospace products and leasing platforms amid evolving market dynamics. The company maintains significant focus on the high-volume commercial engines CFM56-5B, CFM56-7B, and V2500 that service globally prominent narrowbody airframes such as Boeing's Next Generation 737 and Airbus A320ceo families.
The strategic narrative from the quarter centers on FTAI's ambitious asset-light operating model enabled by its 2024-launched Strategic Capital Initiative [S1][S24][S27]. This initiative channels third-party institutional capital—illustrated by the $2 billion equity commitments in the "2025 Partnership"—to acquire on-lease aircraft while FTAI focuses on management services and engine maintenance exclusivity agreements. This model aims to decouple growth from heavy balance-sheet investment in aging narrowbody assets while capturing recurring revenue streams from asset management fees and proprietary Maintenance, Repair and Exchange (MRE) operations.
Liquidity remains a critical strength amid this capital-heavy sector: as of March-end 2026, FTAI reported $412 million cash reserves against total debt approximating $3.5 billion with net debt around $3.08 billion [F1]. The company has secured a revolving credit facility allowing up to $2.025 billion in borrowings across multiple currencies maturing in April 2031 [S3], supporting operational flexibility and potential acquisitions or partnership expansions.
Business Model
FTAI's revenue generation operates across two complementary segments:
Aerospace Products
This segment revolves around the company's proprietary Maintenance, Repair and Exchange (MRE) platform for core commercial aircraft engines: CFM56-5B/7B and V2500 models [S1]. Under this model, FTAI repairs, rebuilds, sells, and leases engines primarily through exchange transactions that optimize uptime for lessees/operators while creating repeat revenue flows. Vertical integration includes dedicated maintenance facilities spanning North America and Europe supplemented by joint ventures specializing in teardown, component refurbishment, module sales, and parts distribution.
The MRE servicing is crucial because these legacy engine types dominate older narrowbody fleets still widely operated worldwide—a market segment characterized by steady aftermarket demand despite newer-generation replacements emerging over time. The integrated nature of FTAI's offering creates switching costs for operators who rely on trusted supply chains to mitigate operational downtime and regulatory compliance during engine overhauls.
Aviation Leasing
This segment manages a portfolio of owned aircraft and engines leased to global carriers. Historically balance-sheet intensive due to ownership of physical assets, the business model is shifting meaningfully through the Strategic Capital Initiative [S1][S24].
By partnering with third-party investors who provide equity for on-lease aircraft acquisition (notably the 2025 Partnership), FTAI reduces capital employed directly on its books while retaining control through asset management agreements. This transition represents a structural realignment aimed at scaling exposure without proportional leverage increases.
Combined revenues stem from lease income streams from aircraft/engines alongside servicing fees related to asset management contracts tied to these capital partnerships.
Revenue Drivers & Margins
Revenue volumes are driven by lease rate agreements largely dependent on global narrowbody utilization trends plus MRE service contracts' volume elasticity linked to traffic growth metrics.
Margins benefit from long-term service relationships within aerospace products that provide relative pricing power versus commoditized leasing where competition pressures lease rates especially under cyclical downturns.
Industry Structure & Competitive Positioning
FTAI operates at the nexus of two industries: independent aftermarket engine services for legacy commercial engines and aircraft leasing focused narrowly on mature narrowbody fleets.
Market Participants & Competitive Dynamics
The aerospace aftermarket space hosts entrenched OEM operators (e.g., GE Aviation) competing through original equipment guarantees but constrained from fully addressing independent lessors' niche requirements around lower-cost refurbished parts.
In leasing markets for single-aisle aircraft powered by CFM56/V2500 engines, participants include large traditional lessors like AerCap or SMBC Aviation alongside non-traditional private equity funds increasingly attracted by yield spreads [S18][S25]. Competitors may have deeper pockets or longer commitment horizons; however, FTAI differentiates through vertical integration of engine servicing closely linked with leasing operations, thereby reducing downtime risk for lessees — an important value proposition amid tight airline CAPEX constraints.
Operational risks tied to facility availability (subject to labor disputes or geopolitical disruptions) underscore the need for geographic diversification which FTAI addresses via maintenance hubs in North America and Europe [S18].
Moat Analysis
The moat derives from:
- Specialized expertise focused on prolific but aging engine models ensuring continued aftermarket demand,
- Proprietary MRE infrastructure delivering cost efficiency gains,
- Exclusive partnerships with key teardown/refurbishment entities enhancing parts cycle economics,
- Strategic Capital Initiative enabling expanded scale without proportional balance sheet strain,
- Established operator relationships enabling underwriting access to scarce narrowbody assets.
Nonetheless, intense financial competition in asset leasing raises continual pricing pressures limiting margin upside outside operational excellence.
Growth Drivers
Structural Demand for Narrowbody Fleet Replacement & Maintenance
The large global installed base of Boeing 737NG/A320ceo aircraft ensures persistent demand for spare engines/modules servicing those fleets well beyond initial manufacturing phases due to typical multi-decade lifecycle usage.
Expansion of Strategic Capital Partnerships
Scale-up efforts via new closed-end partnerships following the successful launch of the initial $2 billion 2025 Partnership offer visibility into fee income growth trajectories from growing managed asset pools.[S24][S27]
Diversification Into Adjacent Aftermarket Services & Geographic Reach
Increasing scope of repair offerings potentially including newer engine types while incremental service provision across diverse global markets could widen addressable market size.
Tailwinds From Airline Traffic Recovery & Cargo Demand Growth
Traffic normalization post-pandemic reinforces flight hours driving both engine overhaul cycles and leasing demand promptly after periods of fleet grounding.[N1]
Risks / Watchpoints / Growth Constraints
- Macroeconomic Cyclicality: Global economic volatility directly suppresses air travel volumes causing cascade impact on lease demand & engine service volumes risking underutilization [S2][S12].
- Geopolitical Risk: Assets located or leased in sensitive regions face sanctions or restricted access risks notably regarding Russia/Ukraine conflict zones impacting repositioning flexibility.[S12]
- Lessee Credit Risk: Airlines’ creditworthiness fluctuates sharply with economic conditions leading to potential defaults or renegotiations undermining cash flow stability.[S22][S25]
- Strategic Capital Initiative Execution: Reliance on third-party capital introduces governance conflicts or raises challenges scaling consistent return profiles aligning investor expectations with operational capabilities.[S21]
- Operational Disruptions: Labor strikes at maintenance locations or supply chain bottlenecks can impair turnaround times severely affecting reputation & margins.[S18]
- Competitive Pressures: Higher capital availability among competitors can compress lease rates or drive asset prices up constraining investment yield spreads.[S17]
- Technological Obsolescence: Emergence of next-gen engines or alternative propulsion technologies could reduce future value/demand for legacy CFM56/V2500 components.[S22]
What to Watch Next
Key monitoring points include:
- Quarterly updates on Strategic Capital Initiative fundings beyond initial 2025 Partnership;
- Lease portfolio occupancy rates & average lease durations signaling stability amid industry cycles;
- Backlog metrics or order intake for MRE services providing early indications of aerospace product demand trends;
- Debt covenant compliance updates considering leverage ratios tied to acquisition thresholds;
- Any announced expansions or joint ventures extending geographic footprint or new engine platforms screened;
- Macro indicators such as jet fuel prices or global GDP forecasts influencing underlying air travel demand patterns.
Financial Profile Highlights (Latest Quarter Ending March 31, 2026)
Latest financial snapshot
| Metric | Value | Period |
|---|---|---|
| Cash & equivalents | $412mm | |
| 2026-03-31 | ||
| Total debt | $3.5bn | |
| 2026-03-31 | ||
| Net debt | $3.1bn | |
| 2026-03-31 | ||
| Current assets | $2.6bn | |
| 2026-03-31 | ||
| Current liabilities | $494mm | |
| 2026-03-31 | ||
| Current ratio | 5.24x | |
| 2026-03-31 |
Source: SEC companyfacts cache [F1].
| Metric | Value (USD) | Period End |
|---|---|---|
| Cash & Equivalents | $412.2 million | |
| 2026-03-31 | ||
| Total Debt | $3.50 billion | |
| 2026-03-31 | ||
| Net Debt | Approx. $3.08 billion | |
| 2026-03-31 | ||
| Current Assets | $2.59 billion | |
| 2026-03-31 | ||
| Current Liabilities | $494 million | |
| 2026-03-31 | ||
| Current Ratio | 5.24x | |
| 2026-03-31 |
FTAI maintains substantial liquidity reflected in its high current ratio exceeding five times alongside a sizable revolving credit facility maturing into early next decade [F1][S3].
Disclaimer: This report is an industry analysis based solely on recent SEC filings and publicly available information up to May 2026. It provides no investment advice but rather an informed evaluation grounded in documented evidence.
Disclaimer: This is research-only, informational analysis and not investment advice. It may include AI-generated interpretation and general industry context. Always verify important details using primary sources.
Comments