
Six Flags Faces Merger Integration Hurdles and Rising Costs Across Expanded Amusement Park Portfolio
Q2 2026 results reveal weather-driven attendance dips, high fixed expenses, and financial strain following the 2024 merger with Cedar Fair.
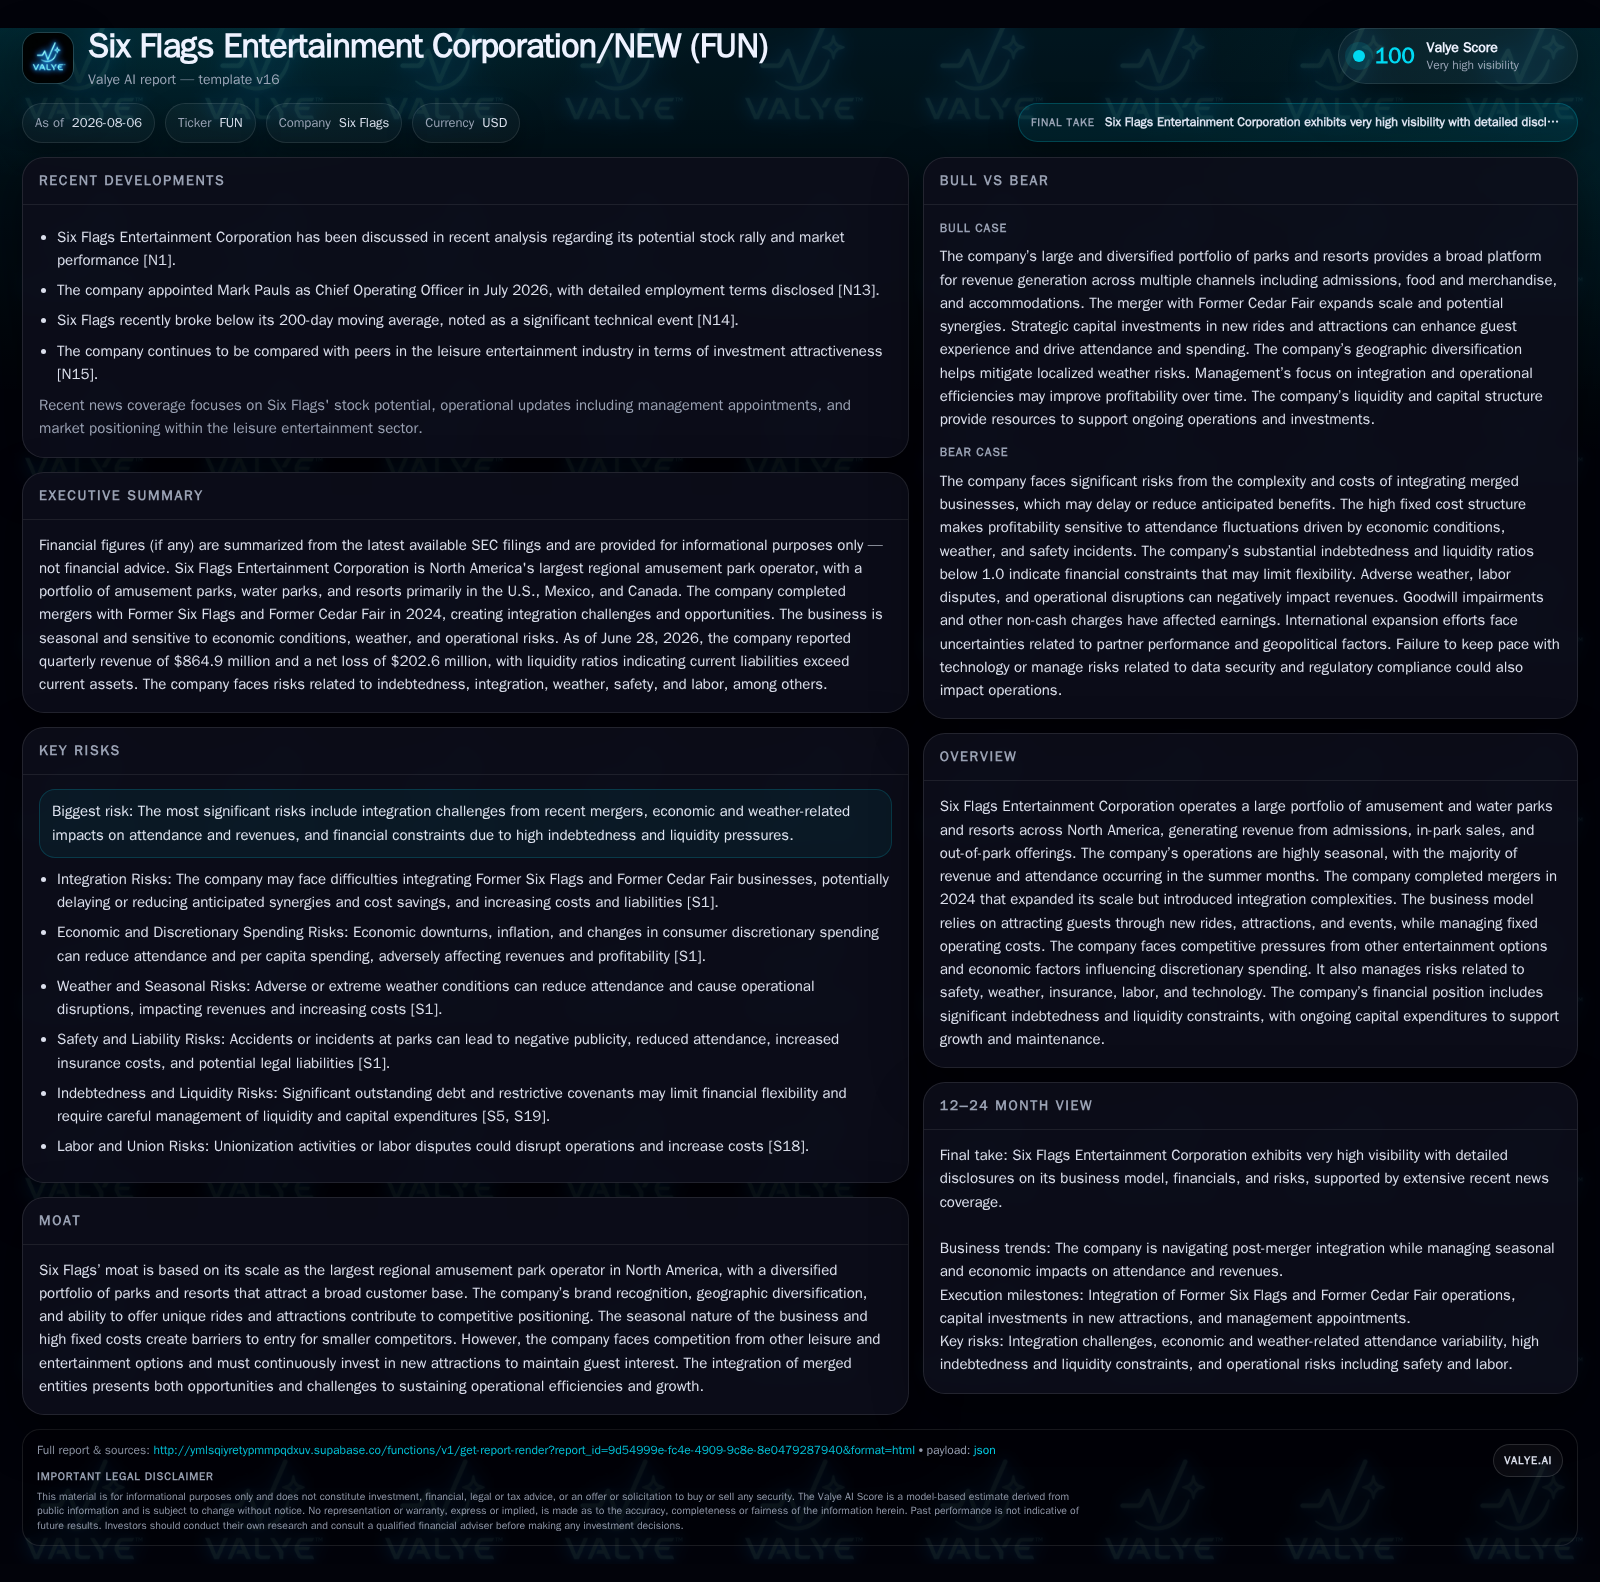
Six Flags Entertainment Corporation’s recent quarterly update reveals ongoing integration complexities stemming from its 2024 merger with Cedar Fair, alongside pressures from seasonality, weather disruptions, and high fixed costs inherent in the amusement park industry. The company operates an extensive portfolio of 41 parks across North America, generating revenues mainly from admissions and in-park spending during peak summer months. Despite scale benefits, Six Flags faces strained liquidity, significant debt, and margin compression aggravated by inflationary cost increases and incremental capital expenditures required to maintain competitive rides and attractions. Its ability to realize merger synergies and optimize operational efficiency will be critical for improving profitability and balance sheet strength.
Recent Operating Update
In response, management is advancing strategic initiatives aimed at accelerating profitability and strengthening the balance sheet. These include park-by-park optimization of pricing strategies underpinned by consumer insights and marketing segmentation tailored to individual park demographics [S18]. Additionally, there is a concerted effort to streamline product offerings to enhance guest value propositions while implementing cost containment programs focusing on overhead efficiency [S18]. This operational discipline reflects a direct effort to mitigate the persistent margin pressure resulting from elevated wage rates linked both to statutory minimum increases and market-driven labor shortages [S1]. Inflationary pressures also affect insurance premiums and the cost of goods sold—including specialized rides sourced globally where tariff policy shifts have increased landed costs [S1]. The complexity of integrating disparate IT systems, operational philosophies, supply networks, and staff cultures from the merged entities continues to require significant managerial focus with payoff timing uncertain [S1].
Business Model Specifics
Six Flags monetizes through three core revenue streams:
- Admissions Revenue: Single-day tickets alongside multi-day season passes sold directly via online portals or box offices generate primary foot traffic. Season passes encourage repeat visits but trade off against higher per capita admissions prices.
- In-Park Product Revenues: Food & beverage sales, merchandise purchases (ranging from branded apparel to souvenirs), games (skill or chance-based), along with extra-charge experiences form a significant ancillary revenue base. Per capita spending here is sensitive to guest demographics and park programming.
- Out-of-Park Revenue: Comprising resort accommodations adjoining parks plus event catering or special programs (e.g., Halloween festivities), these offer premium price points but contribute less proportionally.
The business model’s fixed operating cost structure—dominated by salaries/wages for large seasonal workforces, maintenance of capital-intensive rides needing certification compliance, utilities powering extensive facilities, insurance coverage against multi-faceted risks including safety incidents—and substantial advertising budgets creates high operating leverage [S1]. This leverage rewards incremental attendance growth but penalizes downturns sharply due to relatively inflexible cost bases. Hence active management of attendance drivers—including ride innovations and branded events—is essential.
Industry Structure & Competitive Positioning
The amusement park industry in North America features several notable operators: Six Flags post-merger stands alongside peers such as Cedar Fair (predecessor component), SeaWorld Entertainment focusing on marine-themed parks, and large-scale entities like Disney Parks that leverage global IP assets for differentiation. Compared against this spectrum:
- Six Flags holds a leading position among regional operators due to its diverse geographic footprint spanning key U.S., Canadian, and Mexican markets.
- The company's portfolio benefits from recognized brand equity but must continuously invest in new attractions to challenge alternative leisure options such as streaming entertainment or experiential travel that compete for discretionary spending dollars.
- Seasonality remains a structural constraint unique to outdoor venues exposed directly to weather risks; managing capital spend elasticity during off-season periods is critical for margin sustainability.
- Post-merger complexity adds integration risk uncommon among smaller-scale peers who rely on more uniform business models.
Growth Drivers
Key growth vectors for Six Flags include:
- New Rides & Attractions: Introducing novel or thematically licensed rides drives both attendance uplift and increased per capita spend through premium experiences.
- Season Pass Programs: Expansion of subscription-like products incentivizes visitation frequency while smoothing revenue volatility.
- Geographic Diversification: Parks in varied climatic zones dilute weather impact risk; international exposure may open new consumer segments.
- Technology Usage: Enhancements in ticketing apps or queue management improve guest satisfaction metrics that correlate strongly with repeat visitation.
- Marketing & Branding Partnerships: Licensing popular intellectual properties or engaging in targeted promotions fuels incremental attendance spikes.
These growth initiatives are measured through detailed KPIs including total attendance levels broken by day type (single-day vs season pass), average revenue per guest (per capita spending), breakdowns of admissions vs product spend penetration, net promoter scores reflecting guest satisfaction quality benchmarks, ongoing capital expenditure absorption rates relative to planned budgets, as well as marketing conversion efficiencies [S1,S18]
Risks & Growth Constraints
The firm cites several material risks shaping near-term outlook:
- Merger Integration: Synthesizing two large prior organizations has presented unforeseen costs and challenges delaying realization of projected cost synergies; failure here could lead to diluted shareholder value [S1].
- Economic Cycle Sensitivity: Discretionary consumer spending patterns heavily influence attendance figures; downturns lead to accelerated declines given fixed cost sensitivities [S1].
- Weather Impact: Unseasonable storms or extreme heat materially reduce park visits especially during peak summer months when most revenues concentrate [S1,S2].
- Labor Market Tightness: Rising wage floors complicate seasonal hiring strategies requiring operational efficiencies or price adjustments which may dampen customer demand elasticity [S1].
- Regulatory/Safety Compliance: High standards impose substantial maintenance burdens; accidents could trigger costly litigation and reputational damage as evidenced by ongoing lawsuits related to anticompetitive practices or securities claims [S1,S3].
- Capital Intensity & Liquidity Constraints: Continued high capex required for competitive offerings stresses cash flow particularly with total debt nearing $5 billion amid restricted current liquidity (current ratio ~0.42) limiting maneuvering room for opportunistic investments or refinancing activities [F1].
What To Watch Next
Investors and analysts should monitor key performance signals over subsequent quarters including:
- Same-store attendance recovery trajectories post-weather disruptions alongside new ride launch impacts;
- Trends in season pass sales volume/usage which normalize admission mix shifts;
- Per capita spending fluctuations particularly within food/beverage channels that respond quickly to inflation or promotional discounting;
- Capital expenditure pacing relative to initial guidance ($400–425 million target in 2026) indicating strategic prioritization balance between maintenance vs growth projects;
- Progress on deleveraging as interest coverage ratios remain tight amid significant interest expense burdens approaching $320–330 million annually [S5,S6];
- Incremental updates on merger-related operational efficiencies or restructuring outcomes revealing the degree they translate into margin expansion;
- Any resolution developments regarding pending litigations with potential financial impact;
- Management commentary around macroeconomic effects on discretionary leisure spending intensity given broader inflationary environment shifts.
Financial Profile Discussion
At quarter-end June 28, 2026, Six Flags reported cash & equivalents totaling approximately $135 million against total debt above $5 billion resulting in net debt near $4.9 billion with a notably stressed liquidity profile reflected in a current ratio of approximately 0.42 [F1]
In sum, Six Flags’ financial condition reflects typical challenges faced by large-scale operators balancing growth investment demands against legacy burdens compounded by recent transformative transactions altering organizational scale complexity patterns.
This analysis synthesizes public SEC filings through mid-2026 without speculation beyond documented disclosures. It integrates sector-specific operating characteristics relevant for buy-side diligence but does not constitute investment advice or valuation endorsement.
Disclaimer: This is research-only, informational analysis and not investment advice. It may include AI-generated interpretation and general industry context. Always verify important details using primary sources.

Comments