
General Motors Aligns EV Capacity and Navigates Tariff Pressures While Maintaining Strong Market Position
GM's latest quarterly report reveals strategic realignments in EV production and tariff-related cost management amid evolving regulatory and geopolitical challenges.
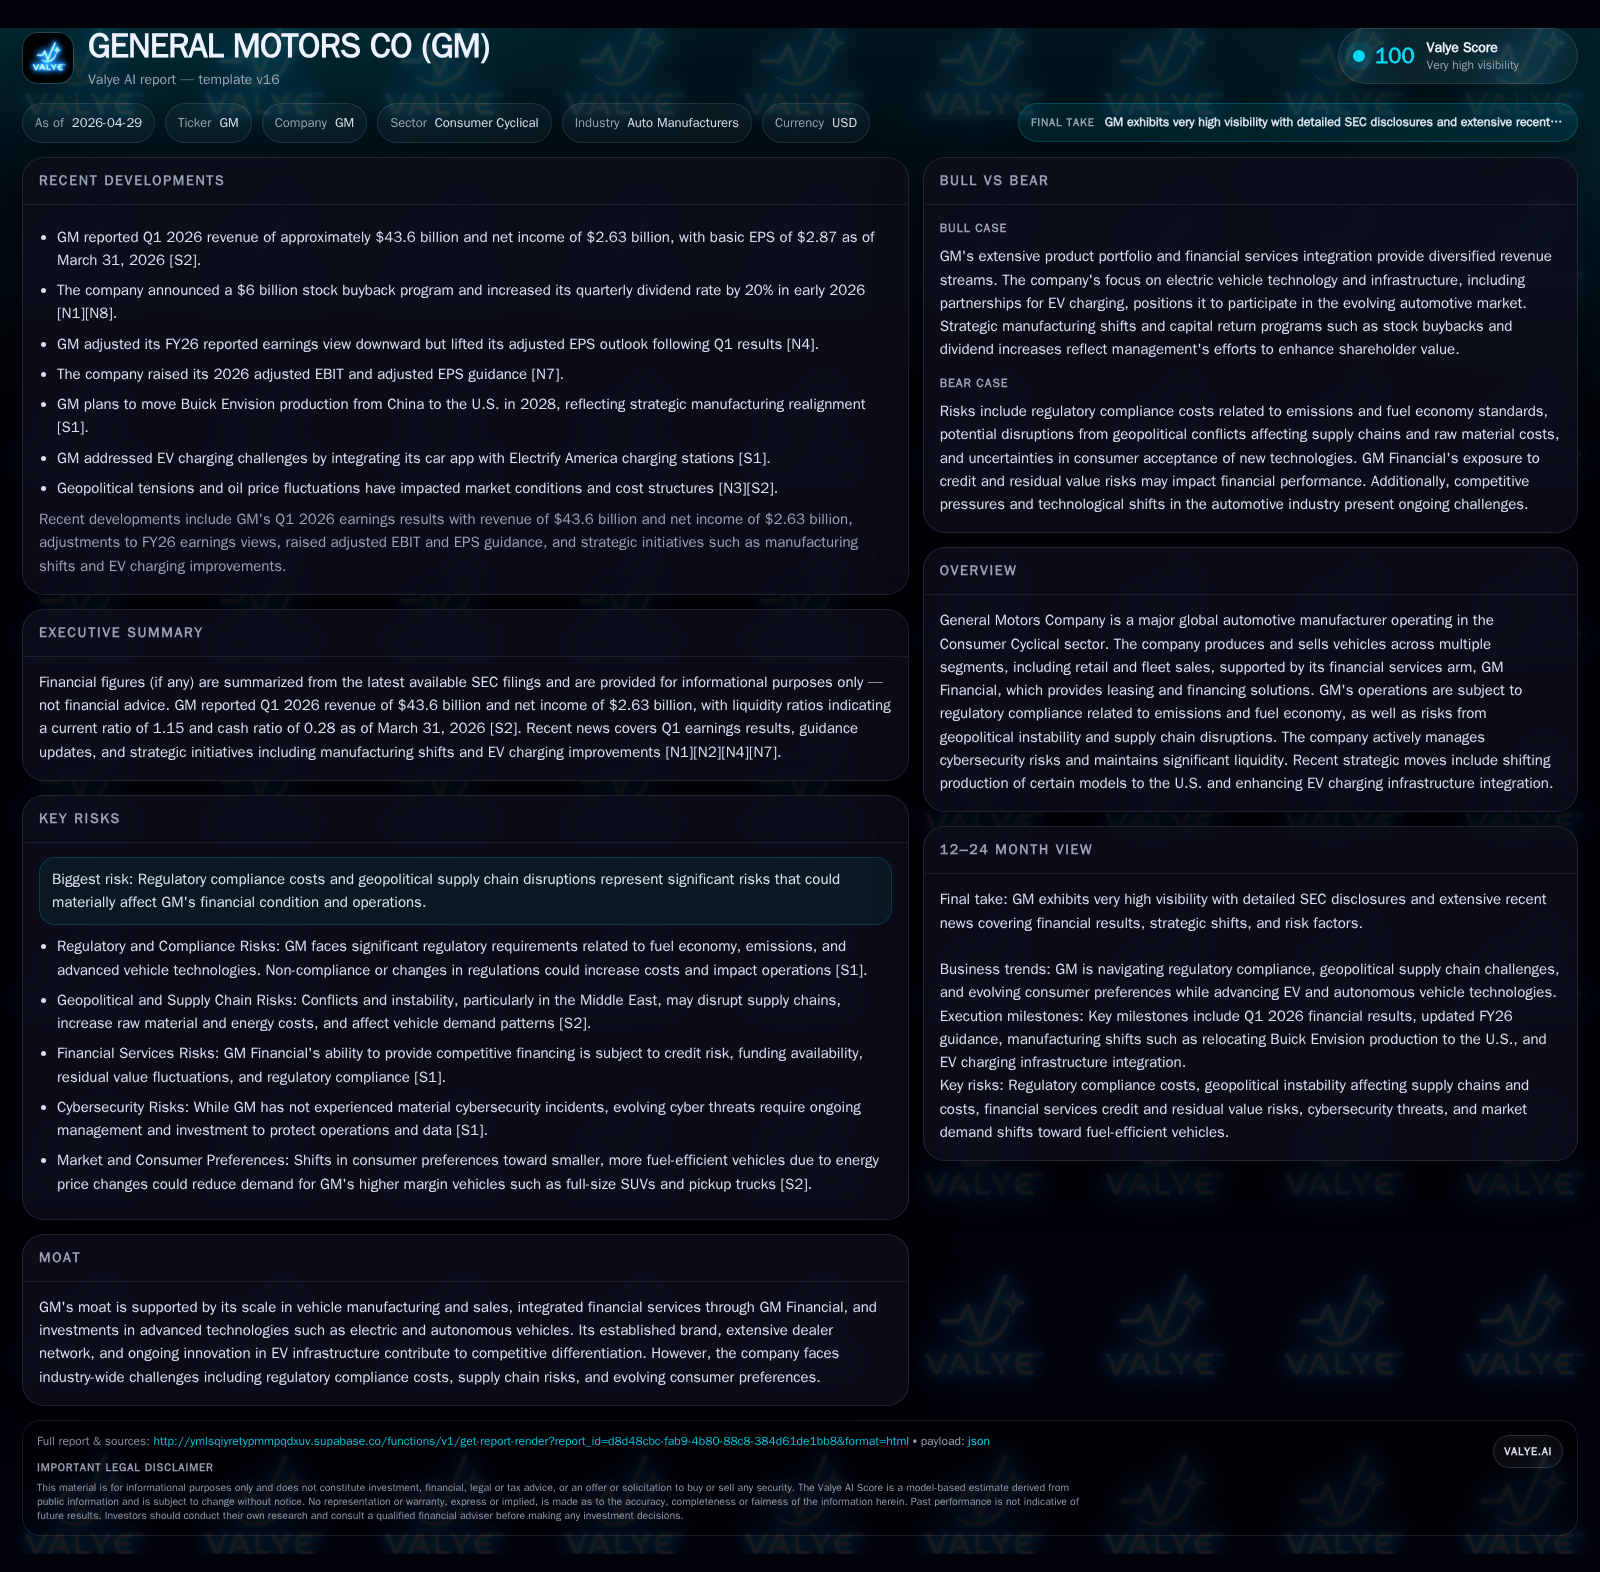
In the first quarter of 2026, General Motors (GM) reported operational adjustments reflecting a continued focus on aligning electric vehicle (EV) production with softer consumer demand following policy changes. The company faces ongoing headwinds from tariffs and supply chain disruptions while leveraging its scale and integrated financial services to sustain profitability. GM's competitive edge is underpinned by its strong truck and SUV portfolio, dealer network, and investments in EV and autonomous vehicle technologies. Key risks include geopolitical instability impacting costs and consumer preferences shifting due to rising energy prices.
Recent Operating Update
General Motors’ latest quarterly filing for Q1 2026 ([S2]) details critical developments shaping its near-term operating environment. The company has concluded its strategic realignment of electric vehicle (EV) manufacturing capacity initiated in response to slowing demand triggered by significant reductions in government consumer tax incentives introduced in late 2024 ([S1]). This reassessment led to substantial restructuring charges recognized mostly in 2025 ($7.9 billion), including asset impairments tied to overcapacity amid softer North American EV sales.
In the current quarter, GM indicates these charges have diminished markedly though it expects some additional non-cash commercial negotiation-related adjustments with suppliers during 2026. Notably, this capacity realignment does not affect the existing retail lineup for Chevrolet, GMC, and Cadillac EV models currently in production.
At the same time, tariffs imposed on vehicles and parts entering the U.S., including those under recent trade agreements such as USMCA, continue exerting pressure. EBIT-adjusted impacts from tariffs were roughly $3.1 billion in 2025 with the company forecasting a range between $3 billion to $4 billion for the full year of 2026 ([S1]). This factor underscores an imperative for disciplined pricing strategies and cost containment across manufacturing and supply chains.
Compounding these challenges are external risks stemming from geopolitical instability particularly involving conflicts in the Middle East ([S2],[S10]). These have disrupted oil supplies and elevated energy costs throughout GM’s logistics networks and supplier base, which may shift consumer vehicle preferences toward smaller or more fuel-efficient models — traditionally weaker segments for GM’s profit profile dominated by large trucks and SUVs.
Business Model Overview
GM operates primarily as a global automotive manufacturer producing vehicles spanning internal combustion engine (ICE), hybrid, and battery-electric segments ([S1],). The company derives revenue chiefly from wholesale vehicle sales to dealers along with fleet customers; retail sales supported extensively via its captive finance subsidiary GM Financial ([S11]). This financial arm provides leasing options, loans, and other retail financing products which help bolster customer retention through lifecycle engagement and mitigate cyclicality inherent in automotive demand.
The firm's portfolio remains heavily weighted towards high-margin full-size pickups and SUVs — segments historically resilient even amidst economic headwinds due to brand loyalty and limited direct competition at scale ([S1]). However, the company is actively investing to expand its electric vehicle offerings while selectively scaling hybrid products aligned with shifting emission regulations globally.
Critical to sustaining competitive advantage is GM’s comprehensive dealer network enabling broad distribution reach. Moreover, GM integrates technology-forward initiatives including personal autonomous driving systems post winding down Cruise robotaxi development. Software-enabled services embedded within vehicles add incremental recurring revenue opportunities supportive of future growth.
Industry Structure and Competitive Position
The global automotive industry is intensely competitive with significant capital intensity required for product development and manufacturing scale. GM competes against legacy automakers alongside emerging pure-electric manufacturers which pose disruptive potential particularly in EV platforms.
GM’s moat stems from:
- Its vast manufacturing scale enabling cost efficiencies,
- Integrated financial services providing customer acquisition synergy,
- Investments in next-generation vehicle technology,
- Established trusted brand portfolio including Chevrolet, GMC, Cadillac,
- Robust dealer network facilitating broad market access.
Nevertheless, substantial challenges persist from regulatory complexities including emissions compliance cost burdens,[S1] evolving consumer tastes especially regarding electrification, persistent supply chain fragility impacting component availability,[S2] and aggressive pricing strategies across OEM peers pressured by new entrants.
Growth Drivers and Constraints
Structural growth drivers include GM’s pivot towards electrification balanced against maintaining leadership positions in profitable ICE-heavy segments like full-size trucks where pricing power remains strong.[S1]
Government policies such as incentives initially spurred rapid U.S. EV adoption but have since been moderated or phased out affecting short-term demand trajectory.[S1] In response, GM optimized production footprints aligning capex toward anticipated volume shifts reducing idle capacity risk.[S1]
GM Financial’s expanding penetration into retail financing supports sustained unit sales across economic cycles,[S11] benefiting from a prime loan portfolio biased towards creditworthy customers reducing credit losses risks even amid macroeconomic variability.
Constraints center on tariff-induced cost inflation that could compress margins if not fully passed through,[S1] geopolitical supply disruptions increasing input price volatility,[S2],[S10] regulatory uncertainties especially connected to emissions standards modifications,[S1], alongside potential shifts away from traditional truck/SUV demand scenario exacerbated by rising fuel prices.[S2],[S10]
What To Watch Next
Key milestones will include updates on:
- Progress resolving supplier commercial negotiations related to EV manufacturing adjustments influencing charge levels for remainder of 2026,[S2]
- Impact trajectory from tariff environment changes given ongoing trade policy dynamics,[N1]
- Vehicle sales data segmented by powertrain type providing insight into consumer preference shifts especially between ICE trucks/SUVs versus EV crossovers,[N2]
- Geopolitical developments impacting commodities pricing or logistical operations that could materially affect cost structures or inventory availability,[S10]
- Regulatory clarifications regarding emissions standards enforcement or credit valuations which can meaningfully swing compliance costs or income recognition.[S1]
Financial Profile Snapshot
As of Q1 2026 ending March 31st ([F1]), GM holds a liquid balance of approximately $19.8 billion cash and equivalents coupled with current assets near $109 billion against current liabilities around $94.7 billion — resulting in a stable current ratio of approximately 1.15 indicating sound short-term liquidity positioning.
Best-effort estimates place total debt at around $5.05 billion leading to a negative net debt position suggestive of ample liquidity buffer relative to financial obligations ([F1]).
The capital structure appears well-managed despite ongoing investment demands associated with transitioning toward electrification capabilities. Efficient execution on capital allocation including restructuring charges tied to capacity alignments remains critical for preserving free cash flow generation going forward.
This analysis is based solely on publicly available SEC filings as of April 28th, 2026 including the company's Q1 10-Q report ([S2]), recent event filings ([S3]), the prior annual report ([S1]), news coverage (), industry context captured in Valye News insights, as well as corroborating financial data from Companyfacts ([F1]). It does not constitute investment advice or recommendations but aims to provide an informed assessment grounded strictly in disclosed facts.
Disclaimer: This is research-only, informational analysis and not investment advice. It may include AI-generated interpretation and general industry context. Always verify important details using primary sources.
Comments