
Genco Shipping's Strategic Fleet Renewal Amid Volatile Drybulk Markets and Debt Reduction
Genco Shipping focuses on a modern diversified drybulk fleet and disciplined capital management to navigate cyclical industry challenges.
Genco Shipping & Trading Ltd continues to pursue growth through selective vessel acquisitions, particularly Newcastlemax and Capesize classes, while balancing financial discipline by substantially reducing debt since 2021. Despite a steep revenue decline in 2025 driven by weak freight rates, Genco maintains liquidity and pays dividends supported by robust operating cash flows. Market volatility, concentrated customer exposure, and evolving trade policies remain key risks influencing its future trajectory. Monitoring charter rates, fleet utilization, and capital expenditure will be important for assessing the company's medium-term prospects.
Company Overview
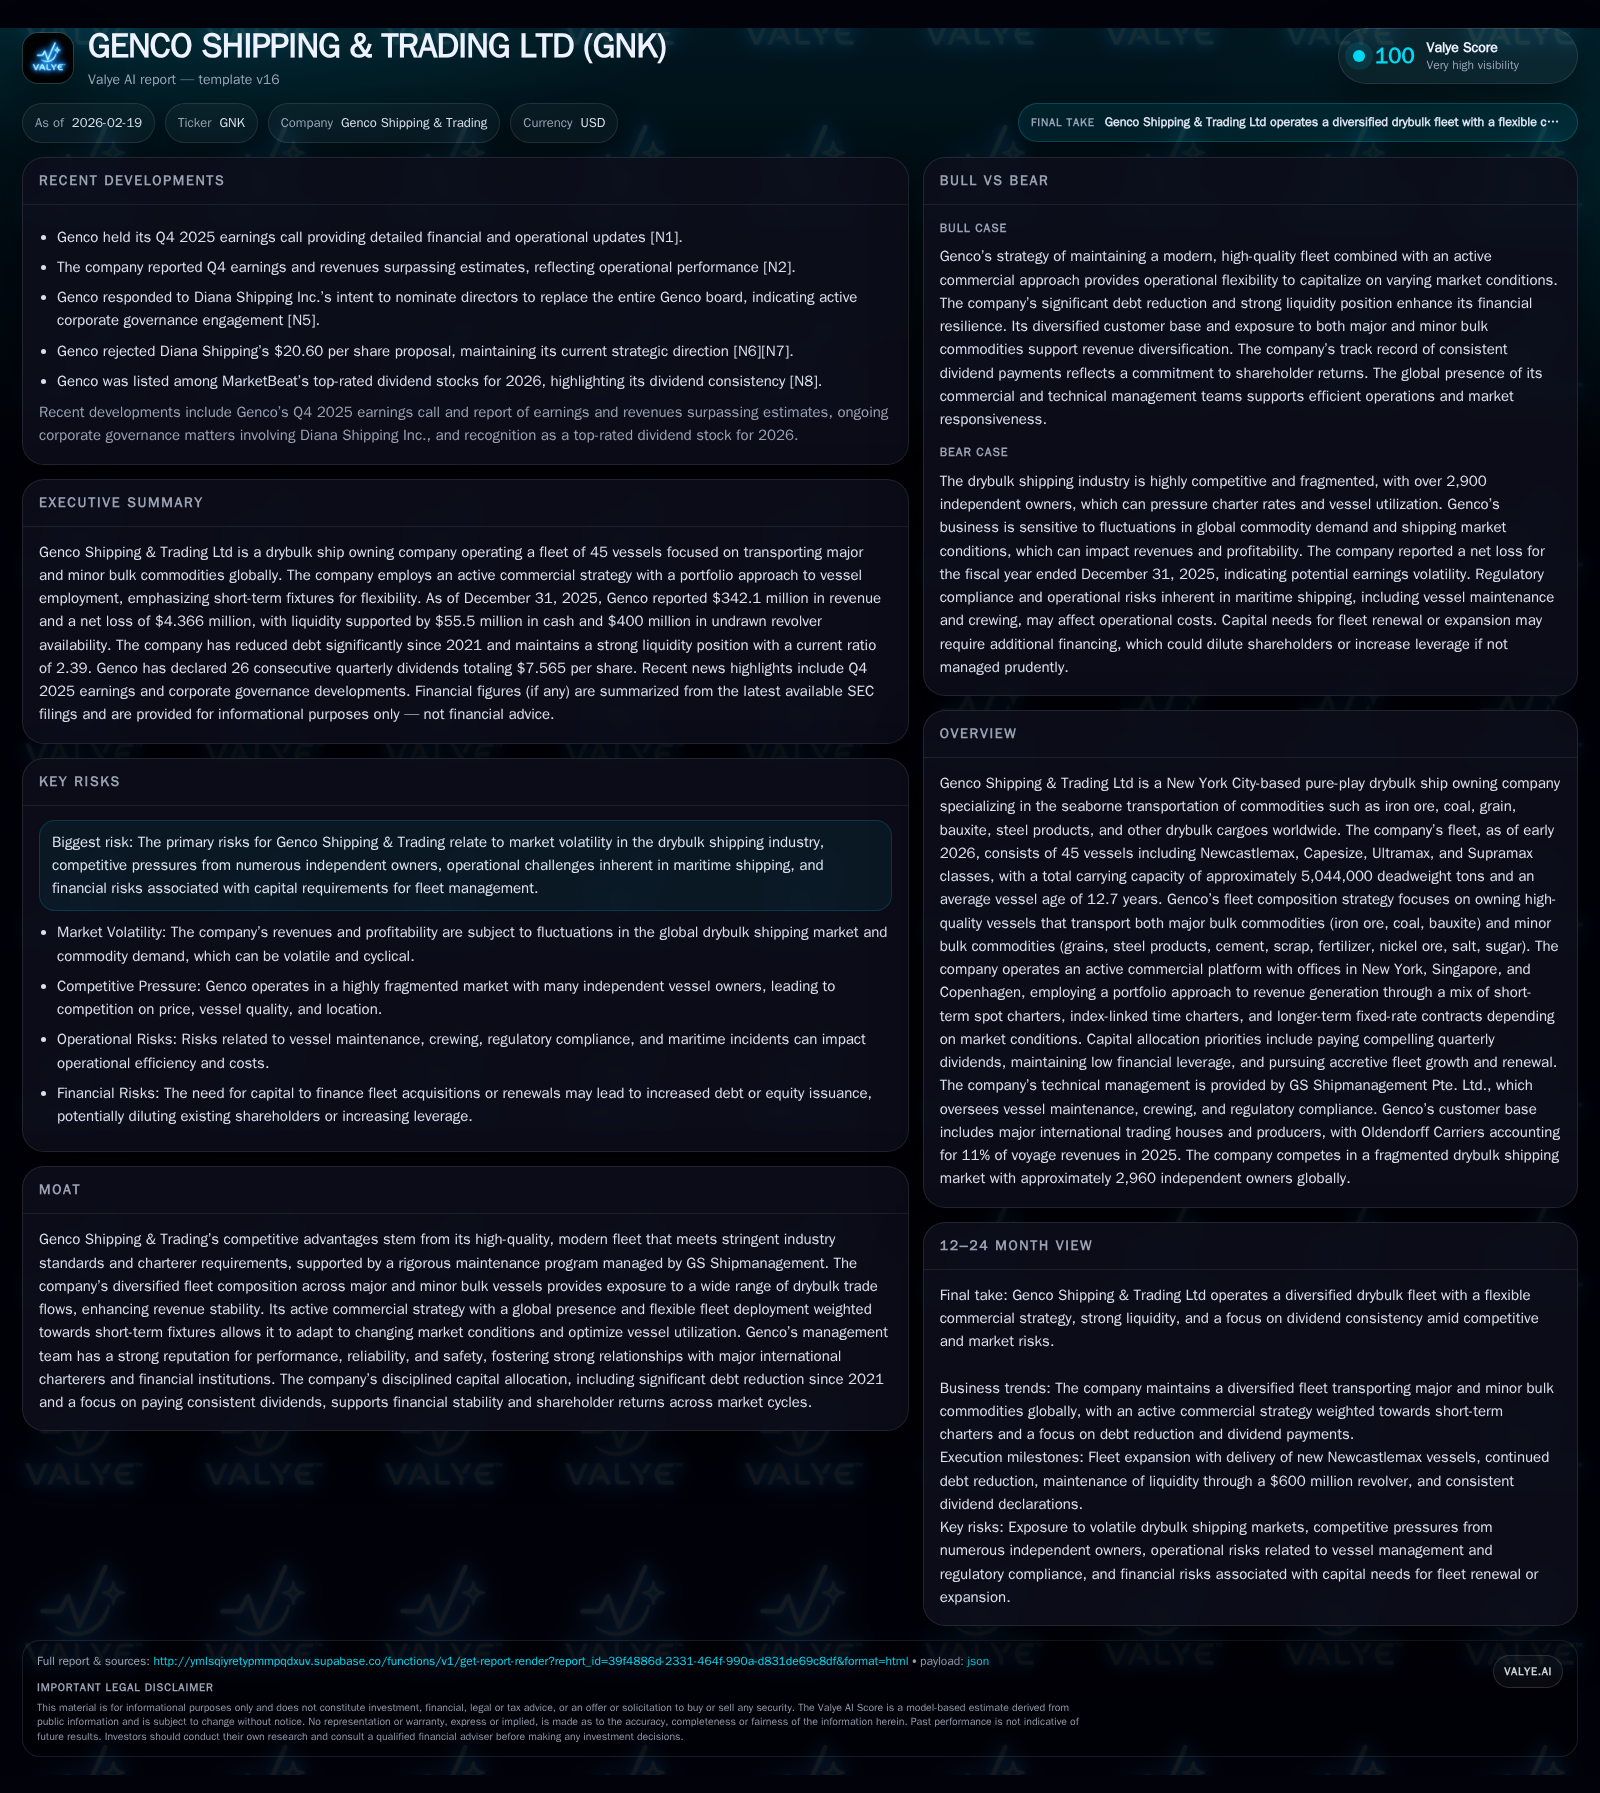
Genco Shipping & Trading Ltd is a pure-play drybulk shipowner headquartered in New York City, focusing on the global seaborne transportation of bulk commodities such as iron ore, coal, grain, bauxite, steel products, cement, fertilizer, nickel ore, salt, and sugar [S1]. As of early 2026, Genco's fleet consists of 45 vessels across four classes: two Newcastlemax, seventeen Capesize (major bulk carriers), fifteen Ultramax, and eleven Supramax vessels (minor bulk). The total carrying capacity is roughly 5.044 million deadweight tons (dwt), with an average fleet age of approximately 12.7 years — indicative of a mature but recently modernized asset base [S1].
Fleet composition strategy centers on diversification between major and minor bulk commodities to tap into varied drybulk trade routes worldwide. Major bulk ships primarily transport large-volume cargoes like iron ore and coal crucial to industrial demand cycles. Minor bulk vessels carry more diverse cargoes including grains and steel products [S1].
The company leverages an active commercial platform with offices in New York, Singapore, and Copenhagen enabling dynamic deployment of vessels via spot market contracts balanced against index-linked or longer-term charters depending on market conditions [S1]. This portfolio approach aims at flexible revenue generation matching market volatility.
Historical Financial Performance
The drybulk shipping industry remains intensely cyclical with performance highly sensitive to macroeconomic factors such as commodity demand cycles, global GDP growth especially in Asia-Pacific economies like China and India, trade disputes affecting export-import flows, and supply-demand balance within the global drybulk fleet.
Genco's financial history over recent years illustrates these dynamics clearly (table below):
Historical performance (annual)
| FY | Rev ($mm) | Net ($mm) | CFO ($mm) | OpInc ($mm) | Rev YoY | Net YoY |
|---|---|---|---|---|---|---|
| 2025 | 342 | -4 | 32 | 7 | -19.1% | -105.7% |
| 2024 | 423 | 76 | 127 | 87 | +10.2% | +693.6% |
| 2023 | 384 | -13 | 92 | -6 | -28.5% | -108.1% |
| 2022 | 537 | 159 | 189 | 167 |
Note: Omitted columns lack sufficient annual XBRL coverage in the provided tags (need ≥2 annual points): Capex, Buybacks. Source: SEC companyfacts cache [F1].
Capital returns and efficiency (annual)
| FY | Div ($mm) | FCF ($mm) | ROE% |
|---|---|---|---|
| 2025 | 33 | 29 | -0.5 |
| 2024 | 68 | 124 | 8.2 |
| 2023 | 41 | 89 | -1.4 |
| 2022 | 116 | 186 | 16.4 |
Source: SEC companyfacts cache [F1].
Note: Data sourced from SEC filings [F1]; dividends exclude buybacks due to lack of recent data.
Revenue peaked during the post-pandemic rebound years driven by elevated freight rate spikes linked to global supply chain disruptions but declined notably in FY25 amid weaker charter rates.
Operating income exhibited extreme volatility—recording strong profits in FY22 followed by losses in FY23 before partial recovery and sharp decline again in FY25.
Net income mirrored this pattern with two loss-making years surrounding a strong rebound year reflecting both market conditions and non-cash adjustments.
Operating cash flow remained positive throughout these periods but contracted significantly in FY25 compared to prior years.
Capital expenditures have been relatively stable around $3 million annually as Genco prioritizes incremental upgrades over large-scale newbuilds.
Dividend payments have been reduced since the peak year but maintained consistently through earnings cycles highlighting management’s commitment to shareholder returns [S10][F1].
Growth Prospects and Strategy
Key strategic priorities driving Genco’s growth include:
- Fleet expansion focusing on Newcastlemax and Capesize vessels: Two Newcastlemax vessels are expected for delivery by March 2026 enhancing the major bulk segment targeting higher-volume long-haul routes [S1].
- Active commercial strategy balancing short-term spot charters with index-linked time charters: This mix provides flexibility to capture upside during freight rate rallies while mitigating downside risk better than fixed long-term contracts alone [S1].
- Disciplined capital allocation emphasizing debt reduction: Since January 2021 Genco has reduced net debt by approximately $249 million (~55%) lowering breakeven cash flow requirements for operations and dividends [S10].
- Dividend continuity: The company declared its twenty-sixth consecutive quarterly dividend for Q4’25 totaling $7.565 per share cumulatively since inception [S10].
- Environmental compliance investments: Installation of scrubbers on newer vessels addresses IMO sulfur emissions regulations providing competitive advantages amid tightening maritime environmental standards [N1][S17].
Growth Constraints & Risks
- Cyclical industry exposure: Drybulk shipping is highly sensitive to commodity cycles heavily influenced by Chinese infrastructure spending trends which remain uncertain given property sector challenges [S1][S7].
- Customer concentration risk: Top ten charterers contribute nearly half of voyage revenues; Oldendorff Carriers alone accounted for about >10% in FY25 [S15]. Loss or reduction from major customers could materially impact results.
- Trade policy risks: Tariffs or port fees arising from US-China tensions may increase voyage costs disproportionately impacting certain flagged vessels; though some fees were temporarily suspended [S1].
- Credit risk under revolving credit facility covenants: While maturity extended through mid-2030 with eased collateral maintenance covenants, defaults could accelerate debt repayments if cash flows deteriorate [S4][S10].
- Competitive pressure: The fragmented drybulk owner market (~3,000 owners) competes intensely on ship age/condition/location/pricing [S15].
- Aging fleet risk: Although refreshed recently with an average age ~12.7 years overall, aging ships require capital-intensive maintenance increasing expense variability [S1][S25].
Financial Condition & Capital Allocation
Liquidity remains robust with $55 million cash plus $400 million undrawn capacity under an upsized $600 million revolving credit facility maturing July 2030 [S10][S4][F1], totaling about $455 million available liquidity.
Net long-term debt stood near $170 million at end-2025 after amortization adjustments representing significant deleveraging since early ’21 [F1][S10]. The credit facility also incorporates interest margin adjustments tied partly to environmental targets reflecting lender ESG considerations [S5].
Free cash flow (operating cash flow minus capex) stayed positive near $28.8 million for FY25 supporting dividend payments despite net losses [F1][S27]. Dividend consistency is notable: twenty-six consecutive quarterly payments including Q4’25 at $0.50/share amounting cumulatively over $7 per share paid since program inception—a strong shareholder alignment signal even amid earnings volatility [N2][S26]. Recent data does not indicate active share repurchases; buybacks appear minimal or absent recently based on available evidence.
Return on equity was approximately -0.5% for FY25 reflecting net losses despite positive equity levels near $896 million at year-end [F1].
Industry Context & Competitive Positioning
Drybulk shipping is characterized by pronounced boom-bust cycles driven largely by steelmaking raw material demand from China affecting Cape-sized vessel utilization. Fleet supply growth depends on newbuild orders placed years earlier creating lag effects impacting utilization. Environmental regulations tightening sulfur emissions encourage scrubber retrofits or greener ships—capital intensive but providing moats for compliant operators like Genco. Operational reliability managed via GS Shipmanagement joint venture enhances reputation—key in minimizing downtime improving profitability margins within tight spreads. Global freight indices have moderated post-pandemic highs but remain vulnerable to shocks such as stimulus measures or energy transitions impacting coal/oil flows requiring flexible operators maintaining optionality across vessel sizes. Recent shareholder activism attempts signal sector consolidation interest though Genco rejected acquisition proposals affirming independence stance [N5][N6][N7].
What To Watch / Forward-Looking Indicators
- Delivery progress of two Newcastlemax vessels scheduled March ’26 impacting capacity mix.
- Trends in Baltic Dry Index and charter rates affecting spot market revenues.
- Capital allocation decisions balancing dividends versus opportunistic vessel acquisitions amid earnings pressures.
- Debt covenant compliance updates signaling financial flexibility under market stress scenarios.
- ESG compliance adherence impacting borrowing costs under credit facility terms.
- Customer contract renewals particularly from top charterers influencing revenue stability.
- Competitive positioning relative to peers managing aging fleets and operational efficiencies.
Disclaimer: This is research-only, informational analysis and not investment advice. It may include AI-generated interpretation and general industry context. Always verify important details using primary sources.
Comments