
Gorman-Rupp Navigates Raw Material Volatility and Cyclical Demand with Heavy Debt Load
Latest quarterly results reflect ongoing margin pressures amid raw material cost fluctuations and cyclical capital equipment demand within a leveraged operating model.
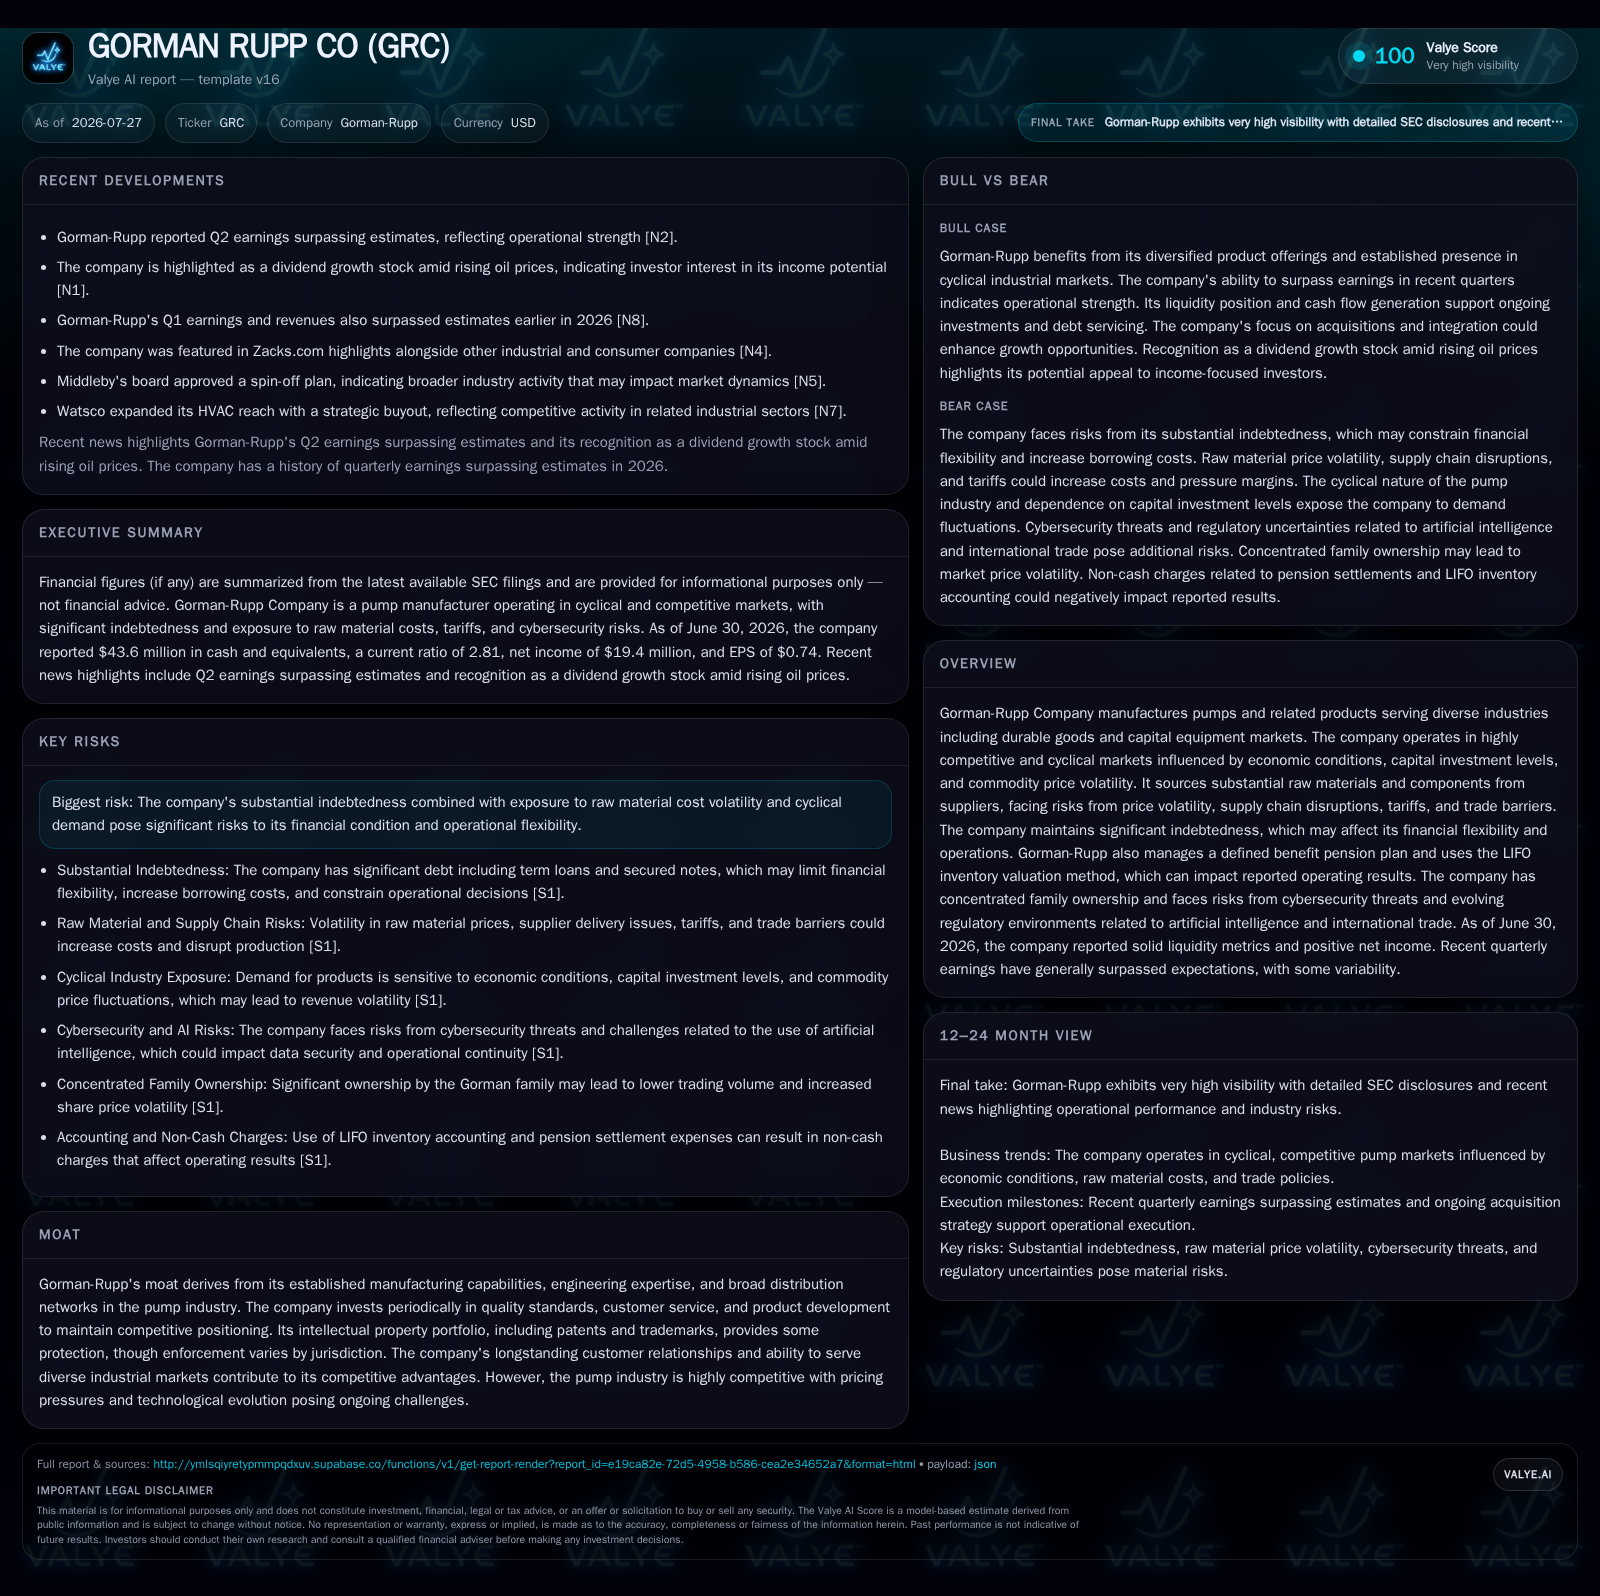
Gorman-Rupp delivered solid Q2 2026 operational results demonstrating resilience in a highly competitive and cyclical industrial pump market. The company continues to manage raw material cost volatility and supply chain disruptions while sustaining substantial indebtedness that constrains financial flexibility. Its business model relies on diversified product offerings including centrifugal and positive displacement pumps, aftermarket parts, and engineered solutions sold to industrial, municipal, and OEM customers across multiple geographies. Key growth drivers remain tied to infrastructure spending and industrial capital investment cycles. However, risks from economic cyclicality, tariff impacts, pension-related expenses, and competition persist, requiring close monitoring of backlog levels, pricing dynamics, and operational efficiency.
Recent Operating Update: Q2 2026 Performance Highlights
Gorman-Rupp Company's latest quarterly filing dated July 27, 2026 (Form 10-Q) reveals ongoing operational resilience amid a challenging macro environment characterized by raw material cost volatility and cyclical fluctuations in capital expenditure among its end markets [S2]. The company announced earnings for the quarter ended June 30 that surpassed estimates according to a recent Nasdaq report [N1], underscoring stable demand conditions despite industry headwinds.
The pump manufacturer reported maintaining stable production with no explicit mention of order backlog shifts but did highlight continued raw materials supply chain pressures impacting lead times and costs. These factors combine typical cyclical demand softness with inflationary input cost challenges common within industrial equipment manufacturing sectors.
Additionally, an important corporate leadership transition was disclosed: longtime CFO James C. Kerr announced retirement effective October 1, 2026, with Vice President of Finance Ronald F. Stoops slated as successor [S3]. This change may influence future financial strategy execution amidst elevated leverage levels.
Business Model: Diverse Pump Solutions with Engineering Depth
Gorman-Rupp operates within the midstream portion of the fluid handling equipment value chain producing a broad portfolio of pumps including centrifugal pumps—optimized for high flow rates at moderate head pressures—and positive displacement pumps used where precise flows or higher pressure heads are required [S1].
Revenue primarily derives from direct sales of these capital equipment products to OEM customers and end-users across industries such as municipal water treatment, oil & gas extraction/processing, agriculture irrigation systems, construction dewatering projects, and general manufacturing utilities. The company also captures significant aftermarket parts revenue which benefits margins due to higher conversion rates and recurring nature.
Monetization occurs through negotiated contracts with OEMs and distributors that often include standard warranty terms alongside optional service agreements. Pricing mechanics hinge on average selling prices modulated by product mix shifts towards specialized or custom-engineered units [S1]. These bespoke solutions serve niche uses requiring Gorman-Rupp’s engineering expertise and patent-protected designs
Notably, the company employs LIFO inventory valuation which can skew reported operating income depending on inflationary trends in raw materials such as steel castings—a critical supplier commodity—with LIFO layer liquidation or buildup impacting tax timing effects further complicating earnings analysis [S23]
Industry Structure and Competitive Position
The industrial pump manufacturing sector is marked by intense competition from peers including Flowserve Corporation, Pentair plc, and Xylem Inc., all broad-based pump providers competing on technology breadth, product reliability, service network strength, geographic footprint diversification, and price competitiveness.
Gorman-Rupp’s moat leverages its long-established manufacturing capabilities headquartered in Ohio with supplemental international operations facilitating sales within volatile currency regimes—particularly exposure to Eurozone economies—and ability to navigate tariffs impacting imported raw material components [S1][S13]. Its intellectual property portfolio encompassing patents secures proprietary design advantages yet enforcement challenges vary globally.
Supply chain disruptions have recently been a strategic concern facing all major pump manufacturers. Efficient capacity utilization remains essential given fixed base manufacturing costs; any production downtime or inventory shortfalls can exacerbate margin erosions during cyclical downturns when order backlogs contract [S1][N1]
Growth Drivers
Structural growth stems primarily from escalating public infrastructure spending focused on water/wastewater treatment upgrades driven by regulatory mandates addressing environmental compliance [S1]. Industrial capital expenditure trends in energy extraction—especially oil & gas—and mining also provide tailwinds subject to commodity price cycles.
Replacement demand complements new capital projects given pumps' critical role in continuous operations; the aftermarket service ecosystem thus contributes significant recurring revenues mitigating some headline cyclicality.
Technological advancements—for instance improving pump efficiency via better hydraulic designs or introducing more durable corrosion-resistant materials—help Gorman-Rupp maintain price positioning against competitors aspiring toward lowest-cost producer status.
Finally, Gorman-Rupp pursues selective acquisitions intended to expand capabilities or enter complementary markets which can accelerate growth beyond organic rates but entail integration risks especially given existing leverage constraints [S1].
Risks and Watchpoints
Key risks center on the company's substantial indebtedness estimated at $278 million as of June 30, 2026 with net debt roughly $234 million after cash reserves—posing restrictions on financial flexibility including dividends or opportunistic acquisitions [F1]. Interest rate fluctuations linked to variable benchmark borrowings heighten financing cost uncertainty.
Raw material prices remain volatile; steel price spikes or logistical bottlenecks elevate input costs potentially pressuring gross margins if customer contracts lack timely price pass-through clauses [S13][N1]. Tariffs imposed by U.S. or foreign governments add another unpredictable layer to supply cost structures.
Cybersecurity threats represent a growing danger given reliance on proprietary technologies and distributed production networks; breaches could disrupt operations or damage reputation [S21]
The defined benefit pension plan remains an accounting consideration where lump-sum settlements exceeding actuarial thresholds trigger recognition of settlement expenses negatively impacting earnings in certain years [S5]. Regulatory changes related to international trade laws or artificial intelligence applications also require ongoing vigilance.
Loss of key personnel beyond planned CFO succession could hamper strategic execution or operational continuity especially in engineering and management tiers integral to product innovation efforts.
What To Watch Next
Monitoring order backlog dynamics will be critical early signals of demand trajectory amidst cyclicality. Changes in average selling prices reflecting pricing power retention or erosion should be watched closely given input cost inflation.
Margin development following raw material cost trends and supply availability will indicate effectiveness of mitigation tactics including supplier diversification or pass-through pricing mechanisms.
The impact of the CFO transition on capital allocation decisions—particularly debt management strategies—will reveal readiness to address leverage challenges while supporting growth initiatives.
R&D spend as a percentage of sales may suggest sustained commitment to technology leadership necessary for differentiation within an evolving competitive landscape.
Given reliance on international sales (~24% export ratio in prior years), currency movements versus USD remain relevant alongside potential geopolitical developments affecting cross-border trade policies [S13]
Financial Profile Discussion
As of June 30, 2026, Gorman-Rupp maintains a current ratio above 2.8 reflecting healthy near-term liquidity with current assets of approximately $248 million against liabilities near $88 million providing reasonable working capital coverage for operational needs [F1]. Cash and equivalents totaled about $44 million offering some buffer for unexpected expenditures or investment opportunities.
Total debt stands at roughly $278 million with net debt near $234 million after accounting for cash balances [F1]. The company's ability to meet interest obligations depends heavily on steady operational cash flow generation tied closely to manageable working capital cycles amid fluctuating demand patterns.
Pension plan funding obligations represent potential non-cash charges if lump-sum distributions surpass actuarial thresholds creating income statement volatility despite no immediate cash impact [S5]
Overall liquidity ratios portray stability while leverage metrics indicate the necessity for careful balance sheet stewardship alongside operational margin improvement initiatives given cyclical headwinds.
This analysis draws exclusively from Gorman-Rupp Company’s SEC filings dated March through July 2026 alongside verified market news sources. It integrates industry-standard KPIs and sector-specific operational insights pertinent to the industrial pump manufacturing landscape without making investment research views.
Disclaimer: This is research-only, informational analysis and not investment advice. It may include AI-generated interpretation and general industry context. Always verify important details using primary sources.

Comments