
Harmonic Inc. Faces Profitability Challenges Despite Strong Cash Flow and Strategic Focus on Software-Based Broadband
Harmonic’s 2025 financials reveal a sharp net loss contrasting with solid operating cash flow amid intensifying competition and high customer concentration.
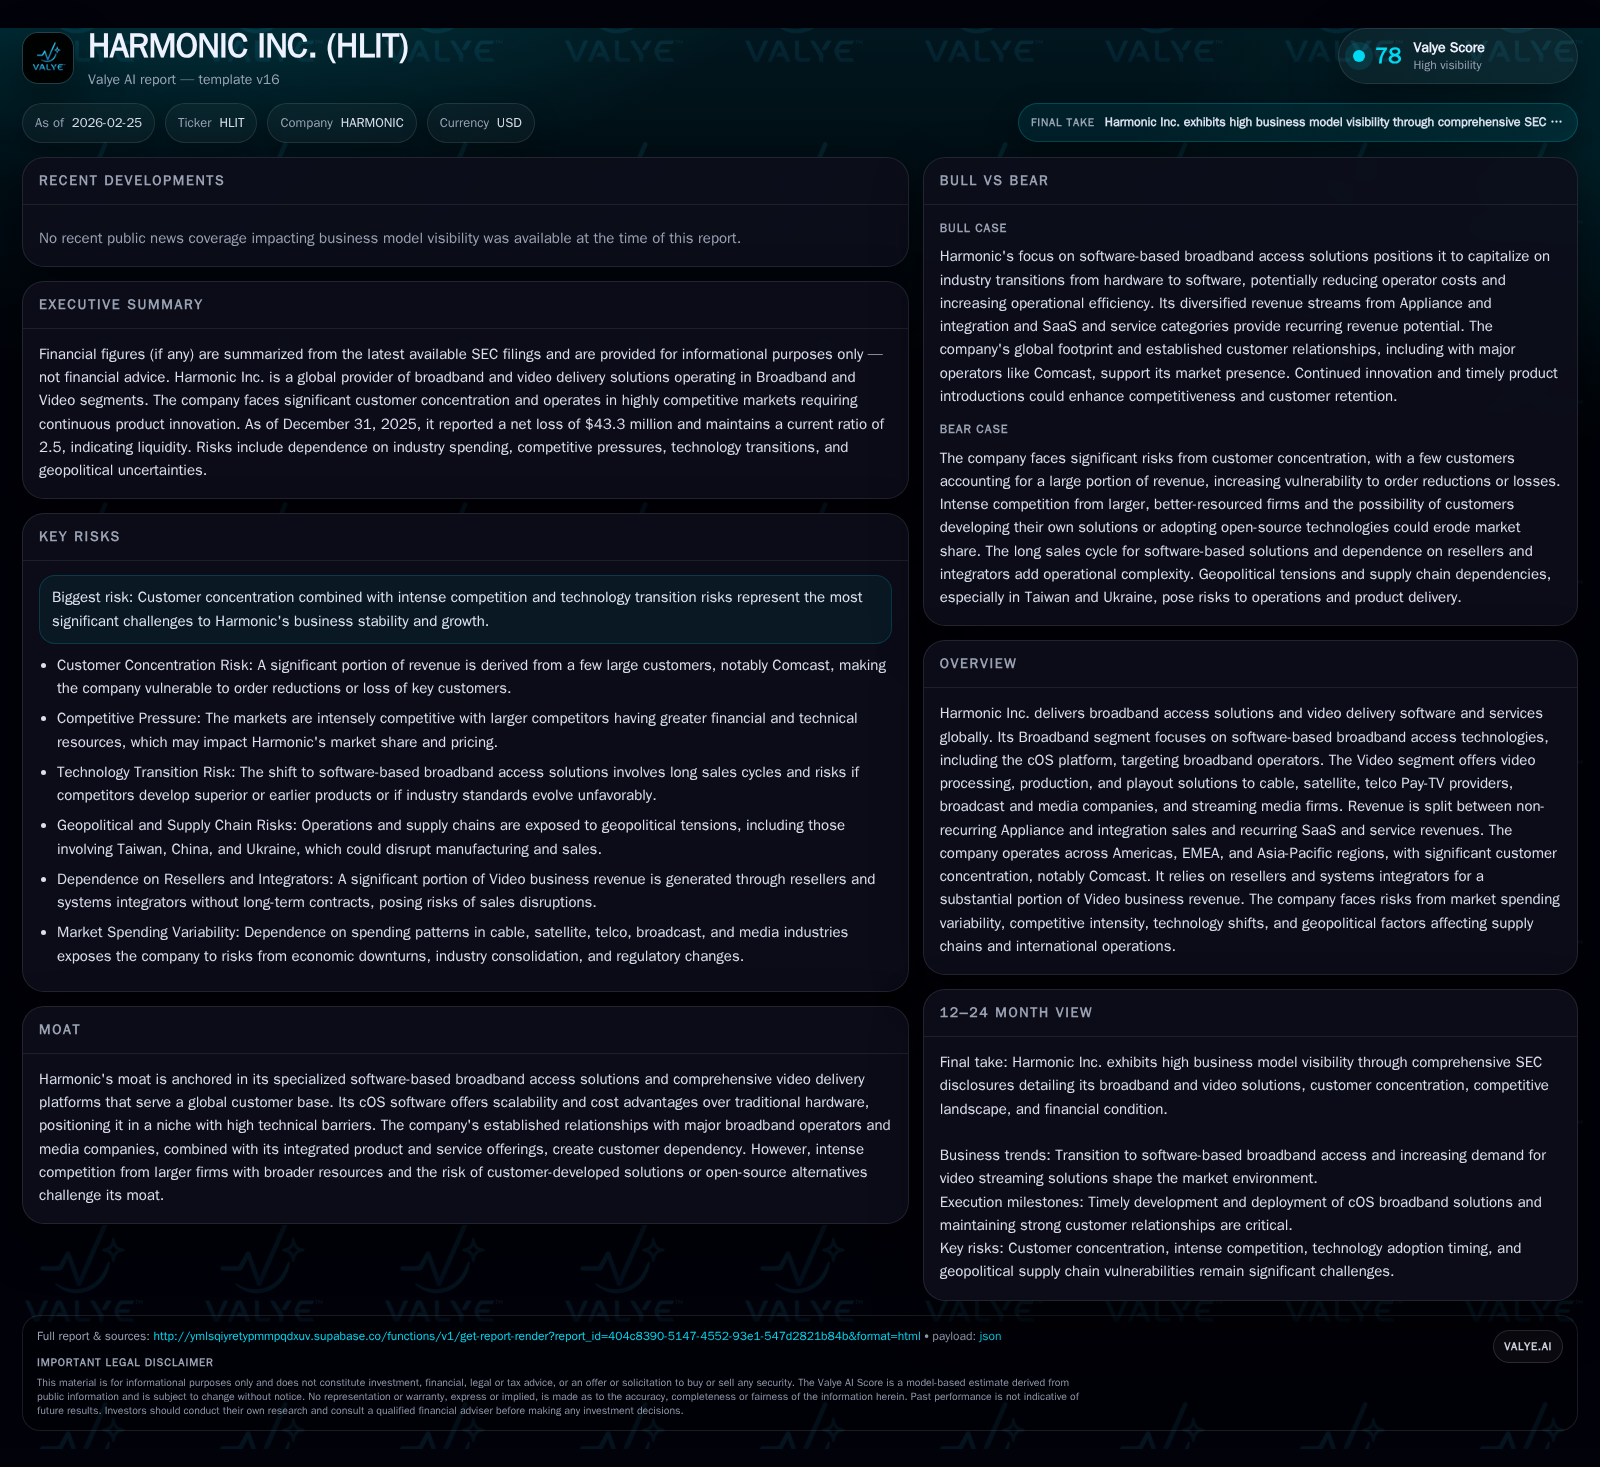
Harmonic Inc. reported a significant decline in net income and operating income in 2025, driven by softer revenue and increased expenses linked to shifting industry dynamics and technology transitions. The company’s broadband segment, anchored by the cOS software platform, targets scalable and cost-efficient broadband access solutions, but project timing and customer spending variability weighed on results. Meanwhile, the video segment saw some growth supported by appliance sales and new SaaS customers. Despite earnings pressure, Harmonic generated robust free cash flow and executed sizable share repurchases. Key risks remain around customer concentration—particularly dependence on Comcast—and ongoing technology shifts in cable and streaming markets.
Company Overview and Industry Position
Harmonic Inc. operates at the intersection of broadband access infrastructure and video processing technology, offering two primary segments: Broadband and Video. The Broadband segment centers on software-based solutions such as its proprietary cOS™ platform designed for broadband operators aiming to deploy scalable multi-gigabit internet services efficiently through distributed or hybrid network architectures. This software focus aims at replacing traditional hardware with more flexible, cost-effective solutions—a competitive edge rooted in technical specialization that forms the core of Harmonic’s moat.
The Video segment serves cable, satellite, telco pay-TV providers, broadcasters, streaming firms, and media companies globally with video processing, production, playout solutions, alongside software-as-a-service (SaaS) offerings. Revenue composition splits roughly between non-recurring appliance/integration sales and recurring SaaS/service revenues.
Key customers include Comcast—a dominant player representing approximately 40% of total revenues recently—highlighting the firm’s high customer concentration risk.[S20][F1]
Industry context includes intensified competitive pressures from larger incumbents with broader portfolios and evolving technology trends such as cloud-native video architectures and accelerating shifts towards subscription-based service delivery models within pay-TV ecosystems. Furthermore, supply chain uncertainties are compounded by geopolitical tensions affecting component availability.[S1][S22]
Historical Financial Performance
Harmonic's fiscal year 2025 results mark a divergence from prior years' profitability trends:
Historical performance (annual)
| FY | Net ($mm) | CFO ($mm) | OpInc ($mm) | Capex ($mm) | Net YoY |
|---|---|---|---|---|---|
| 2025 | -43 | 108 | 14 | 11 | -210.4% |
| 2024 | 39 | 62 | 63 | 9 | -53.3% |
| 2023 | 84 | 7 | 22 | 8 | +198.0% |
| 2022 | 28 | 5 | 46 | 9 |
Note: Omitted columns lack sufficient annual XBRL coverage in the provided tags (need ≥2 annual points): Rev. Source: SEC companyfacts cache [F1].
Capital returns and efficiency (annual)
| FY | Div | Buybacks ($mm) | FCF ($mm) |
|---|---|---|---|
| 2025 | 79 | 97 | |
| 2024 | 0 | 30 | 53 |
| 2023 | 0 | 0 | -1 |
| 2022 | 0 | 5 | -4 |
Source: SEC companyfacts cache [F1].
*Note: Revenue for FY2013 is last reported full annual figure (120M) before later hiatus.
Revenue decreased nearly 10% in FY2025 versus FY2024 due predominantly to softness in broadband project timing and delays related to new technology deployments among key customers,[S18] coupled with continued downshifts in some Video support service contracts.[S17] The operating income contraction was steep—down almost four-fifths largely from margin compression due to reduced volume along with incremental investments required for sustaining and transforming product portfolios amidst intense competition.[F1]
Net income swung materially negative driven by non-cash impairments and restructuring charges booked especially from prior year plans; this illustrates the company's challenges adapting cost structures rapidly enough against revenue volatility.[N1][N4][F1]
Cash flows from operations remained robust at $108 million—nearly doubling prior year levels—reflecting working capital improvements and disciplined collections,[F1] which funded capital expenditures related to R&D facilities and technology assets totaling $11 million.
Concurrently managed share repurchases accelerated significantly with an outlay of $79 million in FY2025 versus $30 million previously indicating active capital return even as earnings remain weak.[F1]
Segment-Level Performance Insights
Broadband Segment
This segment’s strategic differentiator is its cOS software platform that enables broadband operators globally to optimize their network buildouts through a flexible software-driven approach rather than relying strictly on hardware appliances.[S17] The underlying economics appeal particularly amid multi-gigabit DOCSIS deployments and fiber-to-the-home expansions.
Nonetheless, during H1 FY2025, broadband revenues declined by approximately $6 million year-over-year mainly due to delays or altered timelines for appliance deliveries linked to customers’ deployment schedules.[S18] The operating margin compressed accordingly as fixed costs persisted amid lower volumes.
R&D investments have increased specifically here by several millions aiming both at enhancing the cOS capabilities for new standards support (such as DOCSIS3.1 enhancements) and expanding vertical integration opportunities.[S24]
Video Segment
Video saw positive revenue growth primarily driven by higher appliance sales from existing customers alongside incremental gains in SaaS subscribers driven by new logos onboarded.[S18][S19] Support services revenues witnessed modest declines attributed partly to contract cycles timing.
The operating margin improved fueled by better product mix favoring higher-margin appliance sales coupled with cost savings from headcount reductions implemented during prior restructuring waves focused on streamlining operations.[S24]
However, transitioning the business model away from high upfront appliance sales towards more recurring SaaS revenue poses near-term revenue recognition challenges where subscription fees spread over contract terms potentially suppress top-line visibility before longer-term benefit accrues.[S21]
Capital Structure and Liquidity Positioning
Harmonic maintains a healthy overall liquidity position evidenced by:
- Cash & equivalents at $124 million.
- Current assets of approx $494 million against current liabilities below $198 million yielding a current ratio around 2.5x indicating strong short-term coverage.[F1]
However, leverage remains material following debt draws on revolving facilities totaling roughly $113 million used notably for refinancing convertible notes matured in late 2024.[S4][S6][F1]
The company’s recent credit facility includes covenants restricting further indebtedness usage but remains adequate for current operational needs while preserving optionality on future financing if strategic opportunities arise.[S8][S10]
Free cash flow generation has been consistently positive lately (near $97 million last fiscal year), underlining capacity to self-fund capex needs and shareholder returns without overly stretching balance sheet strength.[F1]
Growth Drivers and Challenges Ahead
Growth Catalysts:
- Continued ramp-up of cOS software adoption among broadband operators migrating away from legacy hardware-centric networks offers long-term structural growth opportunity aligned with industry dynamics favoring programmability.
- Winning newer cloud-enabled streaming media customers via integrated end-to-end video delivery platforms may increase share of recurring SaaS revenues supporting steadier top-line streams.
- Geographic expansion into Asia-Pacific markets where fiber rollout acceleration remains underway could diversify revenue base reducing current customer concentration risk dependence.
- Leveraging intellectual property portfolio (including over 180 patents worldwide), enabling enhanced proprietary competitive advantages that discourage direct substitutes or easy replication.[S11][S19]
Constraints & Risks:
- Revenue variability remains tied heavily to spending patterns of few large customers; notably Comcast accounts for ~40%, meaning any delay or order reduction can disproportionately impact results.[N1][N4][S20]
- Competitive intensity includes pressures from bigger-scale incumbents mixing hardware-software bundles as well as emerging open-source or customer-developed alternatives eroding pricing power.
- Transition risks tied to aging legacy product phases into SaaS subscription models may cause uneven near-term top-line performance due to changing billing recognition cycles.[S21]
- Geopolitical tensions contribute potential supply chain disruptions especially affecting hardware appliance components detected across global tech sectors over recent years.[S17][S27][S28]
- Regulatory environment shifts around telecom laws such as net neutrality reversals could change operator investment behaviors impacting downstream equipment purchases adversely.[S25]
- Intellectual property litigation exposure continues amid complex patent landscape of telco/video tech sector requiring vigilance given considerable licensing commitments potentially impacting margins if challenged unfavorably.[S22][S23][S26]
What To Watch Next: Key Milestones & Indicators (Analysis)
- Timing and scale of new broadband operator cOS deployments post-pandemic cycles will be critical signals of renewed order momentum.
- Transition progress toward SaaS revenue mix gains within video platforms indicating sustainable shift away from cyclical appliance sales must be monitored closely.
- Quarterly updates on revenues derived from top customers including Comcast will reflect possible revenue concentration mitigation or intensification trends.
- Operating margin stabilization or improvement reflecting effective restructuring execution combined with controlled R&D spend efficiency merits attention.
- Management commentary regarding further capital allocation plans especially share repurchase pacing relative to valuation perspectives impacts shareholder return profiles.
- Developments around geopolitical supply chain challenges or changes in regulatory landscape affecting trade tariffs or export controls can materially influence operational feasibilities.
- Litigation exposure updates or new Intellectual Property agreements/settlements providing visibility around risk management efforts warrant scrutiny.
Returns & Capital Allocation Summary
Despite weakness in GAAP earnings during FY2025 (net loss approx $43 million), Harmonic's ability to generate over $100 million in operating cash flow translated into substantial free cash flow after capital expenditures (~$97M). This strong cash generation enabled an aggressive share repurchase program deploying nearly $79 million compared with previous year’s modest ~$30 million use,[F1] underscoring management’s commitment toward returning capital even amid profit pressures.
The company currently pays no dividends,[F1] focusing instead on buybacks as its primary mechanism for shareholder returns supported by operational cash flow resiliency.
Return on equity has become negative (~ -11%) reflecting net losses relative to equity base expansion last year but this does not detract from underlying cash conversion health potentially signaling transient challenges rather than fundamental deterioration.[F1]
Research & Development expenses remain substantial—over one-fifth of revenues—primarily funding innovations in both segments ensuring technological relevance amid fast-evolving industry requirements driving future growth potential but also pressuring margins until scale benefits accrue fully.[S24]
Conclusion: Balancing Software Innovation Against Industry Cyclicality and Customer Risks
Harmonic fundamentally rests on its specialized niche within the video/broadband technology space leveraging software-first architectures aimed at helping operators transition into next-generation high-speed networks efficiently while serving evolving media consumption dynamics through advanced video delivery platforms.
While product positioning supports long-term differentiation via its cOS platform and growing SaaS offerings attribution, the business remains exposed acutely to large customer spending cycles (e.g., Comcast), competitive pressures against larger diversified peers offering bundled solutions, plus external macroeconomic/regulatory factors causing spending unpredictability.
Financial performance reflects these dual forces with steep declines in profitability but resilient operating cash flows highlighting solid internal capability to generate funds even under duress—this underpins ongoing investments in R&D aiming at future-proofing solutions poised for eventual growth acceleration once broad market adoption catches up.
Investors should closely monitor upcoming quarterly results focusing on revenue recovery cadence across segments particularly broadband deployments alongside margin trends revealing success of expense restructuring initiatives balanced against necessary innovation investments.
Additionally watching changes in customer-concentration metrics will help assess whether diversification efforts are gaining traction against inherent client dependency risks.
---
Disclaimer: This analysis is informational only based on publicly available data as of early 2026; it does not constitute investment advice or recommendations.
Disclaimer: This is research-only, informational analysis and not investment advice. It may include AI-generated interpretation and general industry context. Always verify important details using primary sources.

Comments