
Hercules Capital Strengthens Income on Elevated Portfolio Prepayments Amid Tech-Focused Credit Risks
Q2 2026 results highlight record investment income driven by prepayment activity and steady credit quality in a niche tech-focused BDC portfolio.
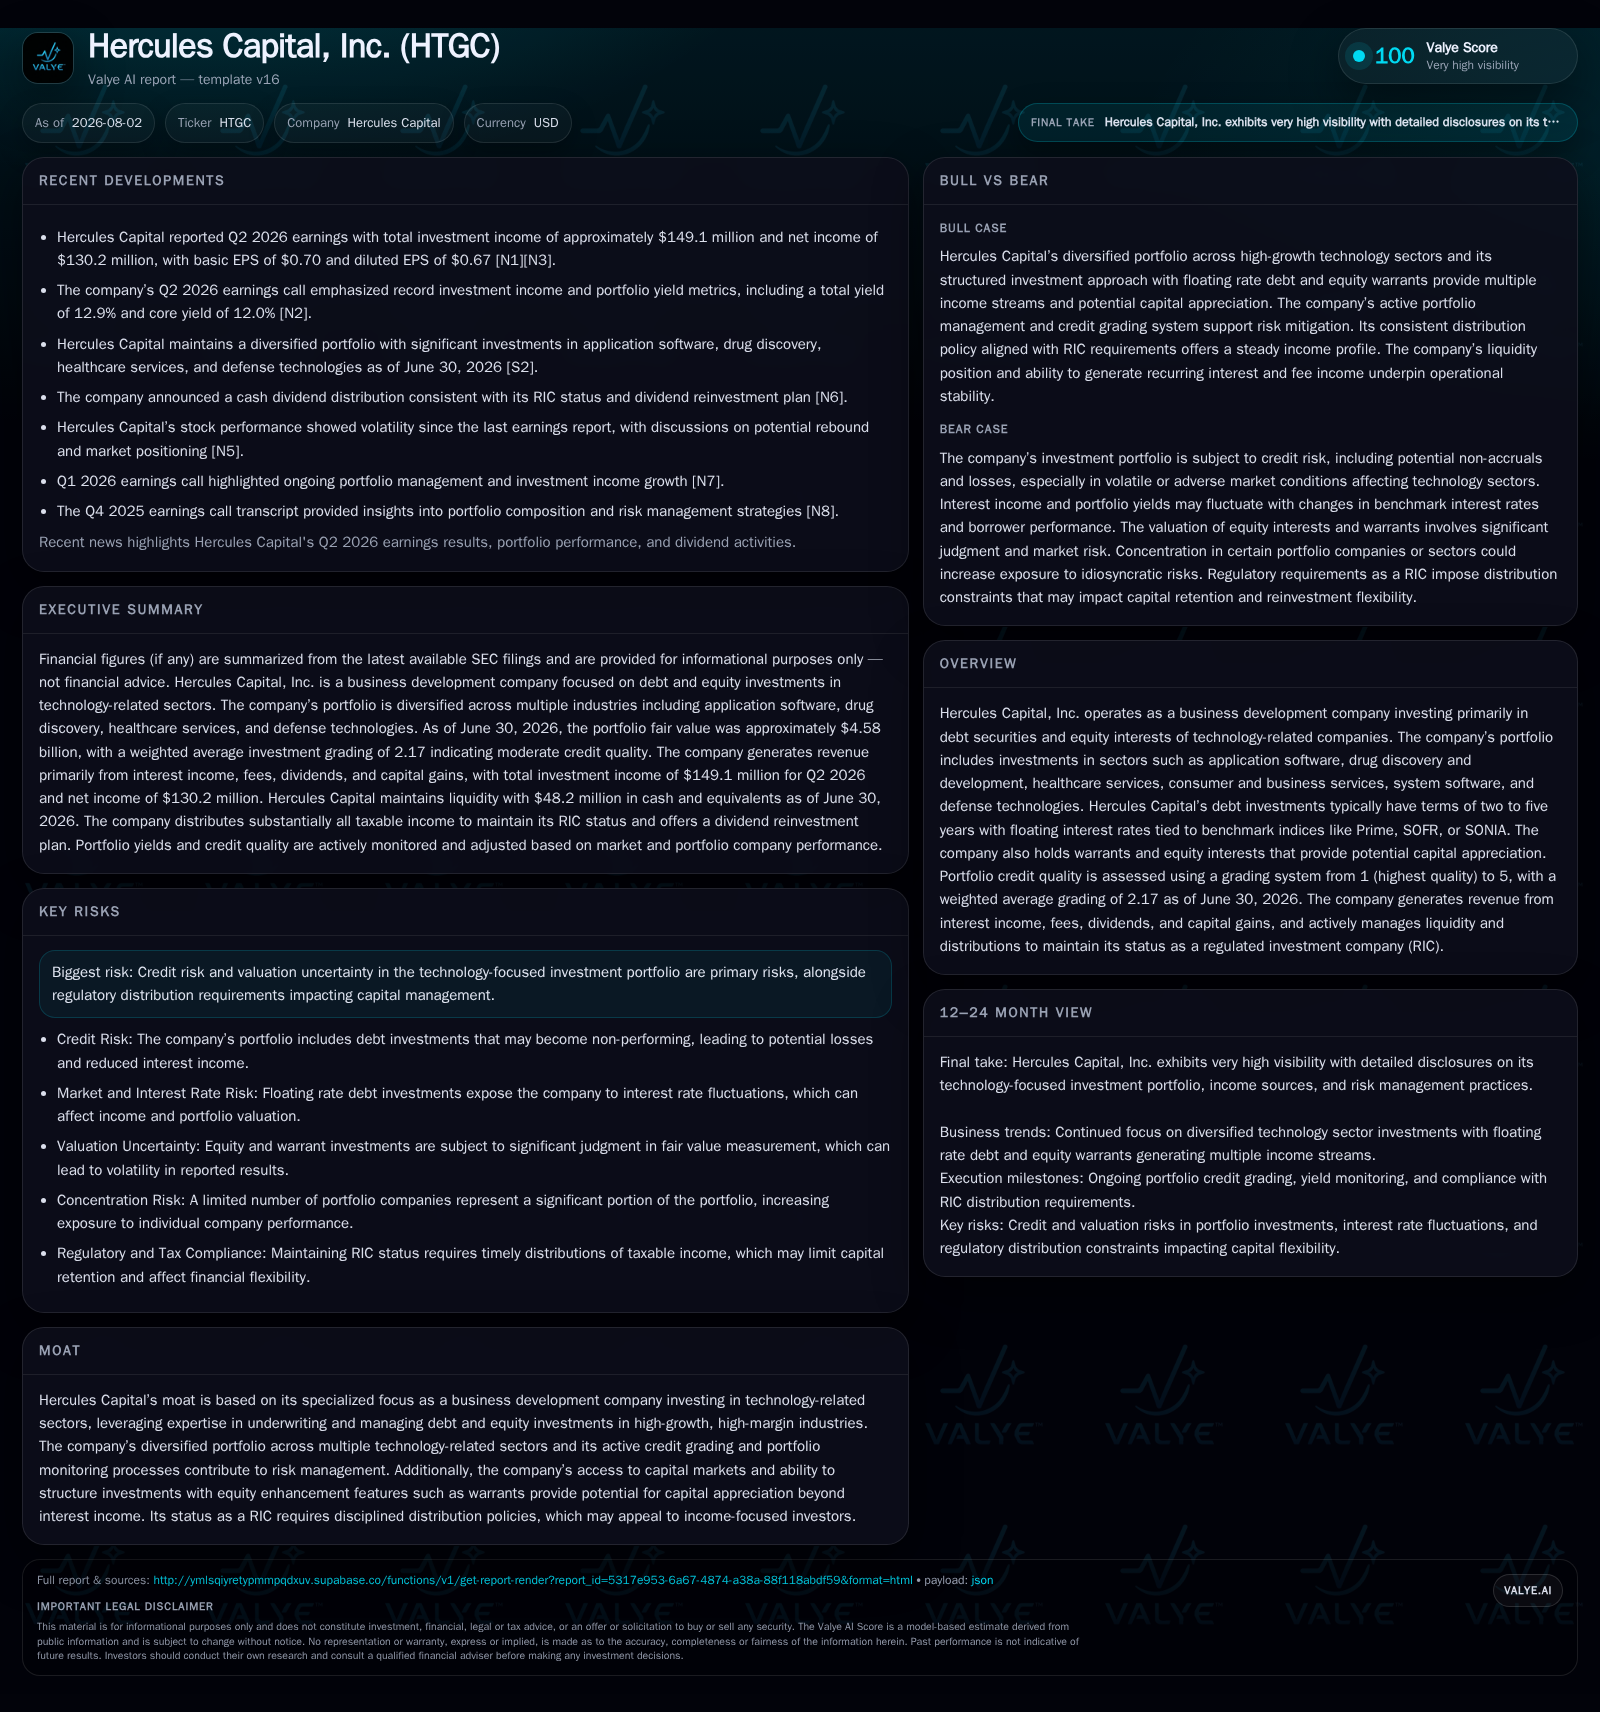
Hercules Capital, Inc. reported second-quarter 2026 results showcasing a notable increase in investment income fueled by elevated prepayments in its technology-centered debt portfolio. The company maintains a diversified portfolio weighted toward sectors like software and life sciences with floating-rate loans typically ranging from 7% to 14% interest. Hercules actively manages credit risk through its grading system, which remains stable. While rising interest rates have supported core yield, total returns are challenged by market valuation swings and non-accruals remain low. The balance sheet features $2.36 billion in total debt with ample liquidity and prudent leverage management compliant with BDC regulatory mandates. Going forward, watch for investment pipeline conversion, asset quality trends, and distribution policies.
Recent Operating Update
Core investment income from the debt portfolio alone reached $131.7 million this quarter, underscoring stable underlying yields despite shifts in repayment patterns [S20]. The company’s loan book predominantly features floating-rate instruments with contractual rates between approximately 7% and 14%, typically structured with maturities spanning two to five years including initial interest-only intervals [S2]. Fee income components such as commitment fees, loan exit fees amortized over loan lifetimes, and payment-in-kind (PIK) interest further enhance return profiles and smooth revenue recognition.
Credit quality metrics remain firm: the weighted average credit grade held steady at about 2.17 on a scale where lower is better quality, reinforcing disciplined underwriting across key sectors including software applications, drug discovery, healthcare services, and defense technologies [N1][S1]. Non-accrual loans represent a modest 0.3% of amortized cost ($16 million on a $4.6 billion portfolio), signaling effective credit risk management even during macroeconomic uncertainties affecting growth-stage companies [S21]. The company continues to apply rigorous non-accrual assessments while recognizing interest when collateral coverage supports expected recoveries.
Business Model Overview
Operating as a publicly traded business development company (BDC), Hercules Capital specializes in providing senior secured debt alongside equity-linked securities such as warrants to innovative technology companies often underserved by traditional lenders due to their stage or sector-specific risks [N1][S1]. Revenue is generated mainly through interest income on floating rate debt investments supplemented by fee income recognized over loan life or upon specific events such as prepayments or modifications.
Equity interests acquired directly or via warrants yield dividends plus potential capital gains upon exit events—creating a hybrid return structure combining steady current income streams with upside optionality aligned with growth company trajectories.
The typical loan amortization schedule ranges from two to five years with principal repaid monthly or ballooned at maturity following initial interest-only periods. This structure requires active monitoring given prepayment risk that can compress yields but also provides liquidity for reinvestment or distributions.
Industry Positioning and Competitive Context
Within the BDC sector—comprising peers like Ares Capital Corporation (ARCC) with diversified portfolios or BlackRock TCP Capital Corp (TCPC) focused on tech lending—Hercules differentiates itself through deep specialization in technology and life sciences lending. This niche demands sophisticated underwriting expertise given the unique intellectual property valuation challenges and cyclicality inherent in these sectors.
Regulatory compliance under the Investment Company Act of 1940 limits leverage via asset coverage ratios; Hercules currently maintains an asset coverage ratio exceeding 212%, excluding SBA-backed debentures which benefit from SEC exemptions allowing enhanced capital deployment flexibility [F1][S5][S14]. Its capital structure balances long-dated fixed-rate notes exceeding $2 billion maturing over several years against revolving credit facilities bearing floating rates totaling approximately $310 million—providing liquidity while managing interest rate exposure prudently.
Equity issuance programs through ATM offerings supplement capital resources enabling responsive scaling aligned with origination pipeline dynamics.
Growth Drivers
Demand for flexible non-bank financing solutions remains robust among rapidly scaling software firms and biotech innovators seeking capital beyond conventional banking constraints. Rising benchmark interest rates enhance portfolio yields due to Hercules’s floating rate exposures while simultaneously accelerating borrower refinancing activity contributing to elevated prepayment volumes.
Visibility into near-term originations is supported by nearly $150 million in non-binding term sheets progressing towards firm commitments alongside about $408 million in available unfunded commitments subject to milestone achievements and formal draw requests [S13][S19]
Risks and Watchpoints
Credit risk remains paramount given exposure to borrowers vulnerable to default or downgrades amidst volatile tech subsectors sensitive to market sentiment shifts or innovation cycles [N1][S21]. Although non-performing assets are currently low, any deterioration could pressure net investment income requiring proactive workout measures.
Valuation uncertainty inherent in Level 3 fair value measurements for illiquid investments introduces earnings volatility reflected in marked-to-market losses despite positive core cash yields—highlighting dependence on market conditions beyond fundamental cash flow generation [S20]. Elevated prepayment risk poses reinvestment challenges potentially compressing long-term yield sustainability.
Dividends remain critical markers of financial health; the declared Q2 2026 dividend of $0.47 per share aligns with distribution policy consistent with RIC status—monitoring payout ratios vis-à-vis net investment income will clarify dividend sustainability versus return-of-capital scenarios ahead [S23]
Liquidity buffers comprising approximately $48 million in cash plus substantial undrawn revolver capacity support operational agility amidst macroeconomic uncertainties influencing portfolio servicing capabilities and funding costs [F1][S12]
Financial Profile Discussion
Disclaimer: This is research-only, informational analysis and not investment advice. It may include AI-generated interpretation and general industry context. Always verify important details using primary sources.

Comments