
IDEX Corporation’s 2025 Financial Momentum and Capital Strategy Unveiled
An in-depth review of IDEX's fiscal 2025 financial results, operational dynamics, and capital deployment strategy shaping its outlook for 2026.
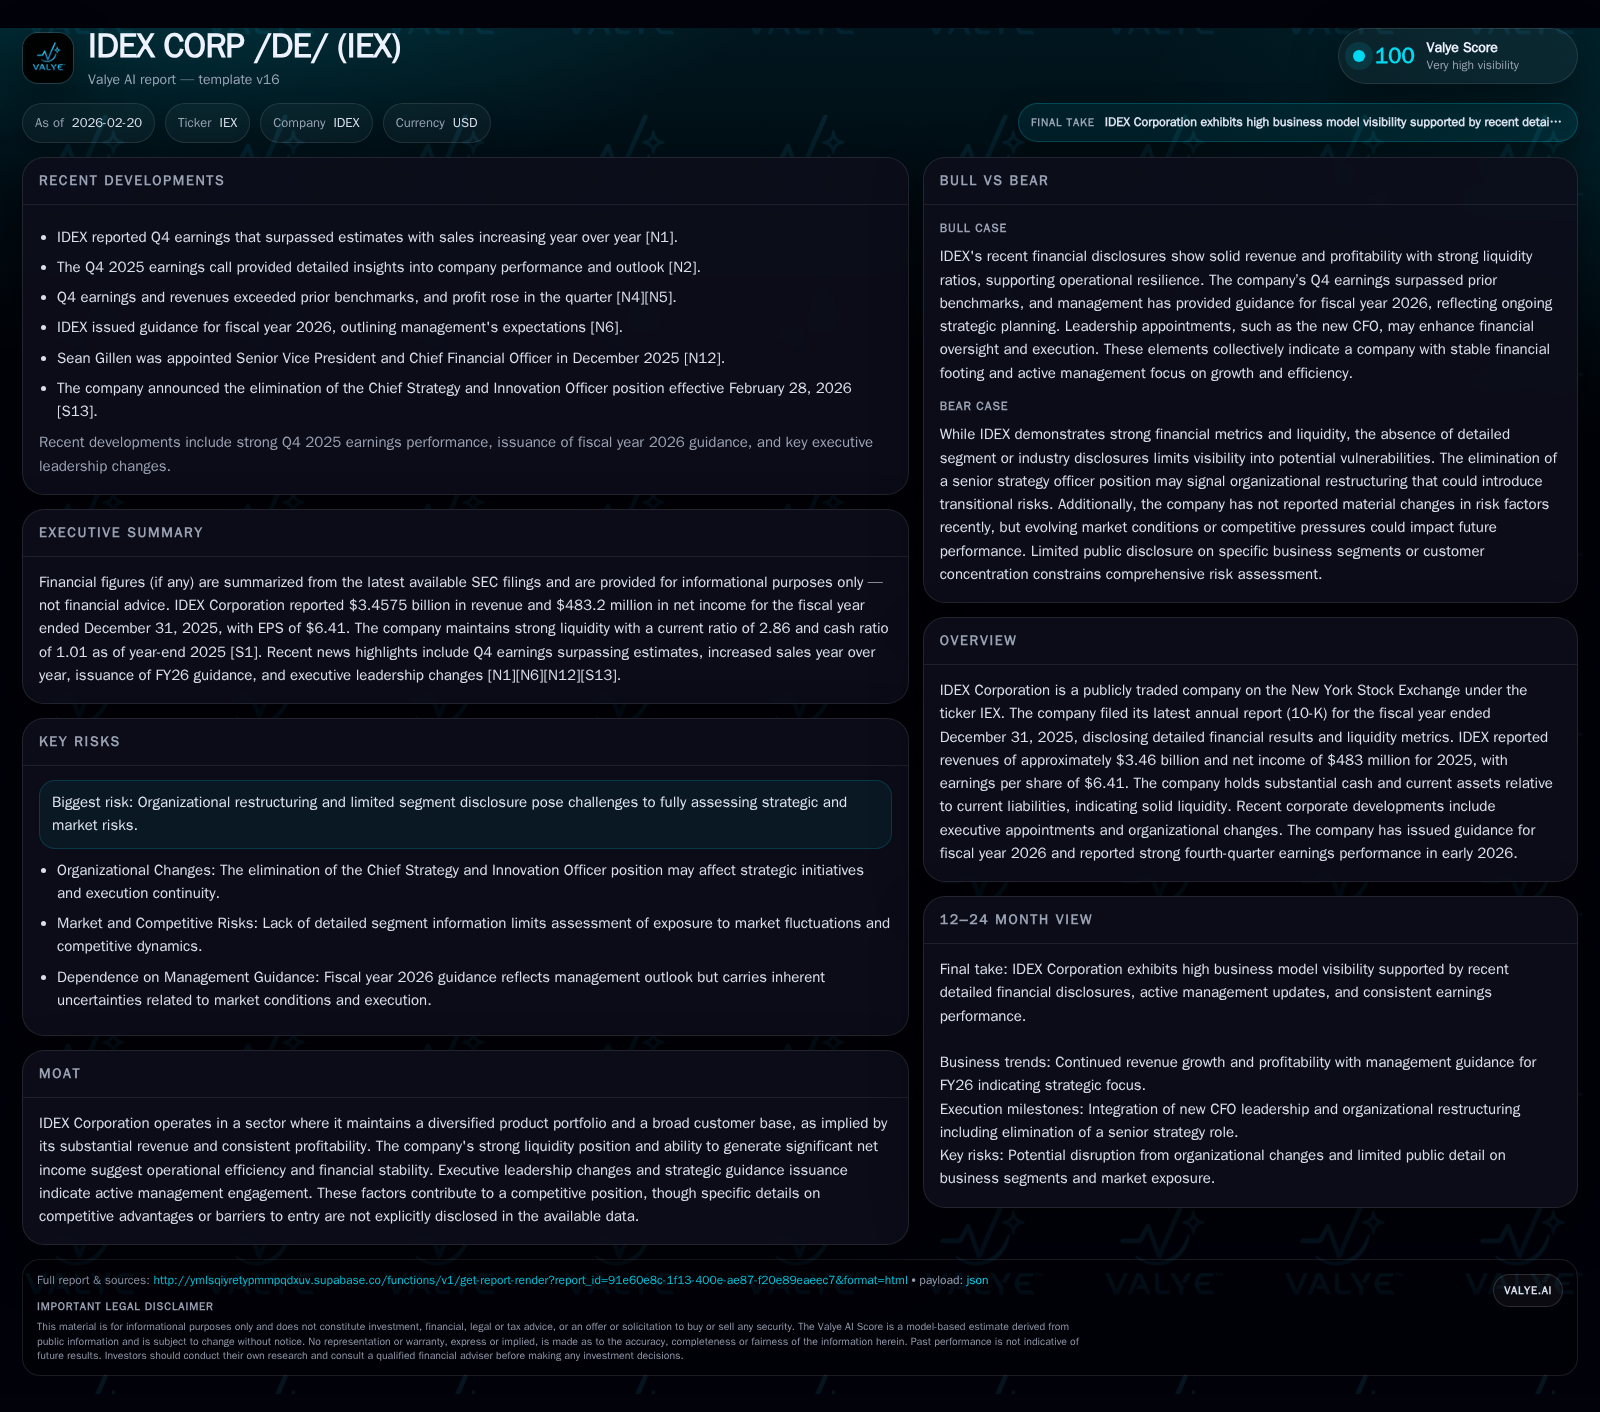
IDEX Corporation reported solid revenue growth of 5.8% in 2025, reaching approximately $3.46 billion with net income of $483 million despite a modest decline year-over-year. The company maintained strong liquidity with a current ratio near 2.86 and executed significant capital returns including dividends and share repurchases. Organizational restructuring marked the year, notably eliminating the Chief Strategy and Innovation Officer role, indicating a strategic refocus. Guidance for 2026 highlights cautious optimism, with areas to monitor including margin trends and operational efficiency amid market uncertainties.
Sustained Revenue Growth Amid Shifting Operational Dynamics
IDEX Corporation delivered solid topline momentum in fiscal year 2025, posting revenues of approximately $3.46 billion, marking a 5.8% increase over $3.27 billion reported in 2024 [F1]. This growth was achieved despite evolving market conditions and internal reorganization efforts [N1],[N4]. Operating income increased by a more moderate 3.3%, reaching $699.3 million, indicative of some operating leverage gains but also reflective of margin compression pressures [F1]. However, net income declined by approximately 4.3% to $483.2 million from $505 million in the prior year [F1], highlighting nuanced profitability challenges.
The divergence between operating income growth and net earnings contraction suggests increased non-operating expenses or elevated costs such as restructuring charges connected to recent organizational adjustments [N2],[S3]. Analysts noted that while organic demand remained resilient across IDEX’s diversified portfolio, margin profiles experienced softness potentially due to higher raw material costs or logistics expenses impacting blended gross margins [N3]. This constellation points to a tradeoff often faced by industrial companies between maintaining market share through pricing discipline versus absorbing cost inflation.
Drivers Behind the Fiscal Year 2025 Performance
Operationally, IDEX’s diverse product base spanning fluidics technologies alongside other engineered equipment facilitated consistent revenue contributions from multiple customer sectors [F1]. Management commentary highlighted ongoing investments in product innovation complemented by steady aftermarket/service revenues as key performance pillars [N2]. This mix likely contributed to sustained organic growth despite competitive pressures.
However, 'margin compression' emerged as an evident term during earnings discussions with references to input cost inflation and currency impacts affecting profitability metrics [N2]. These headwinds suggest that although volume gains were secured, they came at the expense of unit profitability — a common pattern seen when companies prioritize customer retention during inflationary cycles.
Furthermore, restructuring initiatives such as the elimination of the Senior Vice President, Chief Strategy and Innovation Officer role introduce both near-term expenses and longer-term strategic realignment implications [S3],[S16]. Such moves may streamline decision-making but could temporarily disrupt innovation pipelines or market responsiveness.
Outlook and Strategic Priorities for Fiscal Year 2026
Looking ahead, IDEX issued guidance reflecting cautious optimism on full-year fiscal 2026 performance [N5]. While specific revenue targets were not detailed extensively beyond qualitative expectations for continued organic expansion, management emphasized monitoring cost inflation trends and executing on efficiency initiatives.
Key indicators to watch in upcoming quarterly results include gross margin trajectory and operating income leverage — metrics closely tied to execution on cost control measures as well as pricing power amid competitive environments . Additionally, the ability to sustain free cash flow generation will inform capital allocation flexibility moving forward.
Importantly, the company's liquidity buffer provides cushion against macroeconomic volatility while enabling tactical investments aligned with strategic priorities outlined during management’s communications [N2],[S17].
Capital Allocation Focus: Dividends, Buybacks, and Cash Management
Capital return policies at IDEX have demonstrated renewed vigor post-2024 with dividends paid rising marginally to about $213 million in 2025 from $205 million the prior fiscal year [F1]. Simultaneously, share repurchases accelerated significantly to approximately $248 million after negligible buyback activity in FY2024, underscoring robust free cash flow utilization [F1],[S8],[S14],[S16].
From a valuation perspective informed by buy-side norms, consistent dividends combined with opportunistic buybacks reflect confidence in cash flow generation quality and balance sheet strength. The approximate return on equity for FY2025 stands near 12%, balancing profit retention with shareholder distributions effectively [F1]. Capital expenditures declined slightly to about $63.6 million amid maintained reinvestment discipline supporting organic growth initiatives without excess capital intensity [F1].
This measured capital allocation framework aligns with industry best practices prioritizing shareholder value creation while preserving liquidity for acquisitions or innovation funding if attractive opportunities arise.
Liquidity Position Strengthening Operational Flexibility
IDEX's balance sheet remains healthy with total cash and equivalents nearing $580 million as of year-end 2025 — representing an impressive current ratio of roughly 2.86 given current liabilities standing at about $575 million [F1],[S9],[S11],[S13],[S17]. This robust working capital position facilitates agility amidst ongoing restructuring and broader economic uncertainties.
Maintaining such liquidity is especially pertinent considering sector volatility surrounding supply chain disruptions or cyclical demand changes typical in engineered solutions markets . Moreover, the company's ability to generate operating cash flow approximating $680 million represents effective cash conversion cycles despite elevated operating costs this past year [F1]. Thus, IDEX possesses a buffer that mitigates refinancing risks while empowering strategic choices around capex deployment or dividend policy adjustments without compromising financial stability.
Navigating Executive Changes and Structural Realignments
February 2026 filings disclosed significant organizational changes including the departure of Roopa Unnikrishnan from her post as Chief Strategy and Innovation Officer through position elimination—a move signaling potential recalibration of corporate governance structures or innovation strategy focus areas within IDEX [S3],[S16].
Such shifts are not uncommon in industrial firms seeking streamlined operations; however they carry risk considerations relating to innovation continuity or long-term differentiation potential. Complementing this change was the appointment of Sean M. Gillen as Chief Financial Officer at the start of calendar year 2026 bringing deep industrial finance expertise from prior roles at AAR Corp and investment banking experience at Goldman Sachs [S19],[S18].
From an investor relation standpoint, leadership stability combined with focused stewardship under new CFO oversight may enhance capital efficiency metrics including working capital optimization or return on invested capital improvements—crucial levers during periods of margin pressure.
Key Metrics Recap — Historical Financial Snapshot
The following table summarizes selected key financial metrics reflecting IDEX’s performance trajectory from FY2022 through FY2025:
Historical performance (annual)
| FY | Rev ($bn) | Net ($mm) | CFO ($mm) | OpInc ($mm) | Rev YoY | Net YoY |
|---|---|---|---|---|---|---|
| 2025 | 3.5 | 483 | 680 | 699 | +5.8% | -4.3% |
| 2024 | 3.3 | 505 | 668 | 677 | -0.2% | -15.3% |
| 2023 | 3.3 | 596 | 717 | 733 | +2.9% | +1.6% |
| 2022 | 3.2 | 587 | 557 | 751 |
Note: Omitted columns lack sufficient annual XBRL coverage in the provided tags (need ≥2 annual points): Capex. Source: SEC companyfacts cache [F1].
Capital returns and efficiency (annual)
| FY | Div ($mm) | Buybacks ($mm) | FCF ($mm) |
|---|---|---|---|
| 2025 | 213 | 248 | 617 |
| 2024 | 205 | 0 | 603 |
| 2023 | 191 | 24 | 627 |
| 2022 | 177 | 148 | 489 |
Source: SEC companyfacts cache [F1].
Note: Operating Income = OpInc; Cash from Operations = CFO; Capital Expenditures = Capex; YoY percentages computed where data allows.
This snapshot confirms steady revenue expansion counterbalanced by mixed earnings outcomes subdued partially by cost factors impacting margins beyond operating income line—typical tradeoffs for manufacturing-centric businesses managing inflationary inputs.
Disclaimer: This analysis is intended solely for informational purposes based on publicly available data as of early 2026 and does not constitute investment advice or recommendations.
Disclaimer: This is research-only, informational analysis and not investment advice. It may include AI-generated interpretation and general industry context. Always verify important details using primary sources.
Comments