
IPG Photonics Bolsters Manufacturing Efficiency as Fiber Laser Market Evolves
Q1 2026 filings reveal IPG’s scale-driven cost improvements amidst evolving fiber laser pricing dynamics.
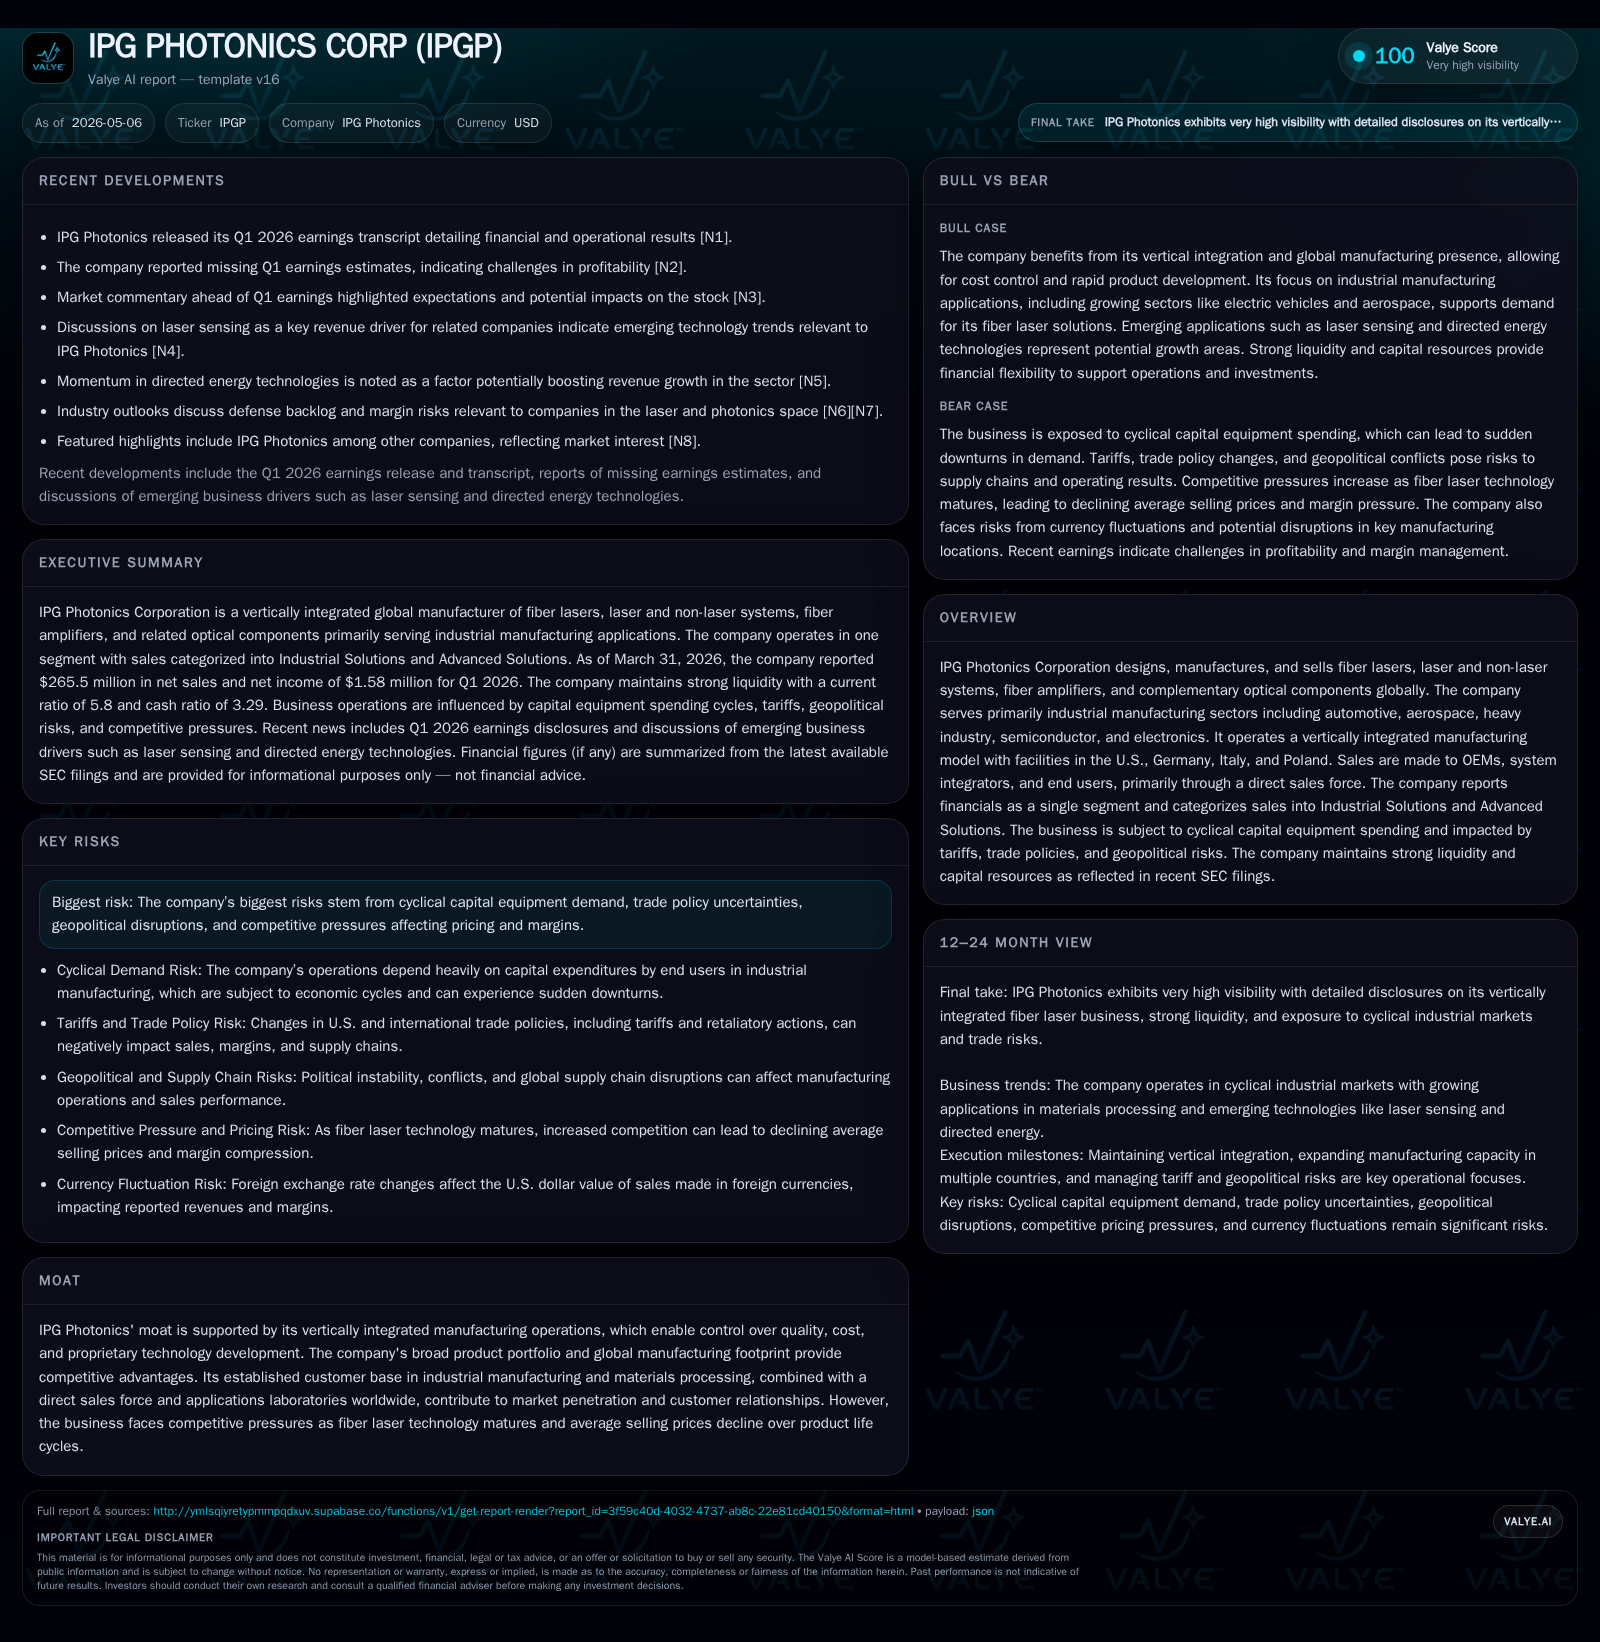
IPG Photonics’ latest quarterly report highlights improved manufacturing economies of scale, driven by higher-power fiber lasers utilizing more optical components to absorb fixed overhead costs. Specialty product margins remain robust due to limited competition. The company’s vertically integrated model supports flexibility and quality control amid a maturing industry with pricing pressures. Capital equipment cyclicality and geopolitical factors pose ongoing risks, while liquidity and leverage profiles remain strong going into 2026.
Q1 2026 Operational Update: Detailed Insights from Latest Filing
IPG Photonics’ most recent quarterly filing dated May 5, 2026 ([S2]) reveals key operational dynamics shaping its near-term performance. A notable development is the increased use of optical components in higher power fiber lasers, which improves absorption of fixed manufacturing overhead costs—an important factor driving economies of scale. This structural leverage supports incremental margin expansion as volumes rise.
The company also reports that certain specialty products deliver higher gross margins due to scarcity or absence of equivalent competing offerings ([S2]). While volume buyers benefit from lower per-unit pricing, this price concession is partially offset by better fixed cost absorption on larger order volumes. These unit economics nuances indicate a disciplined balance between pricing strategy and fixed-cost leverage.
Geopolitical exposure remains a point of note; IPG disclosed that its Belarus subsidiary's net asset value was reduced by $17.4 million from cumulative translation effects amid currency depreciation. However, with only $4.3 million in remaining long-lived assets there and a marginal net working capital deficit excluding cash, operational disruption or immediate cash impact appears contained ([S2]).
An additional event filing ([S3]) reiterates these points in the company’s earnings announcement context for the same quarter.
Core Business Model: Vertical Integration and Product Portfolio Strength
At the heart of IPG’s business lies a vertically integrated manufacturing footprint encompassing facilities in the U.S., Germany, Italy, and Poland ([S1]). This integration facilitates end-to-end control of product quality, innovation cycles, and cost structures. By managing critical subcomponent fabrication internally—especially optical fibers and amplifiers—the firm reduces supplier dependency while enabling closer alignment of technology development with customer application needs.
Revenue generation consolidates around two main application categories since early 2026: Industrial Solutions (materials processing including automotive and aerospace) and Advanced Solutions (medical, defense, micromachining) ([S23]). Customers span OEMs, system integrators, and end users who typically purchase laser devices either as discrete units or embedded systems via a direct sales model supported by localized applications laboratories.
Pricing power is nuanced; while the broad fiber laser market undergoes commoditization pressures as technologies mature globally ([N2]), IPG leverages its portfolio breadth and differentiated specialty products to mitigate headline average selling price erosion. Notably, switching costs embed through technical support depth and integration complexity.
Competitive Landscape and Industry Structure: Technology Maturation Challenges
The fiber laser industry is at a crossroads: rapid past growth driven by superior performance attributes is increasingly moderated by price compression as adoption saturates core industrial applications ([S1]). Competition intensifies among OEMs capable of developing or sourcing similar fiber laser solutions. In response, global players emphasize vertical integration — much like IPG — to optimize supply chain bottlenecks around critical optical components.
Trade policies and tariffs have complicated global sales strategies given geopolitical frictions; these issues also influence regional pricing schemes and customer allocations across IPG's international footprint ([N2]). Although growth ceilings are evident in mature industrial sectors, specialty niche developments such as medical-grade lasers or custom defense applications provide differentiation buffers.
Growth Catalysts: Leveraging Manufacturing Scale and Specialty Products
Key drivers underpinning prospective growth revolve around further capturing economies of scale enabled by increased uptake of high-power lasers requiring more embedded optical parts—thereby distributing fixed manufacturing costs over larger volumes ([S2]). Additionally, specialty product lines commanded stable or improved margin profiles because fewer competitors can match technical specifications or certifications needed in those domains.
Expanding into emerging geographic markets or adjacent advanced applications offers incremental penetration potential. System integrator relationships facilitate cross-selling opportunities for bundled solutions encompassing IPG’s laser hardware plus integrated subsystems ([N1]). Continued R&D investments signal management's commitment to proprietary innovations sustaining competitive moats ([S15]).
Risks and Limitations: Capital Cycle, Trade Policies, and Pricing Pressures
The company's revenues remain sensitive to cyclical capital equipment spending patterns prevalent within target industries such as automotive manufacturing or semiconductor fabs ([S1]). Economic slowdowns can materially reduce order intake leading to volatility in quarterly results.
Trade policy uncertainties inject additional demand-side risk affecting volume forecasts especially in regions impacted by tariffs or export restrictions ([N2]). The Belarus subsidiary’s net asset devaluation evidences geopolitical currency exposure without significant liquidity drain currently but underscores potential headwinds if circumstances deteriorate ([S2]).
Competitive pricing pressures arising from technological commoditization threaten gross margins particularly outside specialty product lines where differentiation is less pronounced ([N2],[S1]). Managing inflationary input cost increases without fully passing through price hikes remains an ongoing challenge.
Upcoming Milestones and Market Signals to Monitor
Key near-term metrics include weekly order backlog health particularly across Industrial vs Advanced Solutions segments ([S3]). Monitoring changes in geographic demand patterns will be critical given ongoing geopolitical flux impacting regional supply chains.
Technological rollouts involving next-generation fiber laser architectures or proprietary system upgrades could provide inflection points if commercialized successfully ([N3]). Additionally, observing management commentary around capacity utilization adjustments or capital expenditures for expanded manufacturing lines may indicate anticipated demand shifts.
Financial Overview: Liquidity, Covenant Compliance, and Balance Sheet Strength
Latest financial snapshot
| Metric | Value | Period |
|---|---|---|
| Cash & equivalents | $481mm | |
| 2026-03-31 | ||
| Current assets | $1433mm | |
| 2026-03-31 | ||
| Current liabilities | $247mm | |
| 2026-03-31 | ||
| Current ratio | 5.8x | |
| 2026-03-31 |
Source: SEC companyfacts cache [F1].
IPG Photonics enters Q1 2026 with a robust liquidity position featuring approximately $480.8 million in cash and equivalents ([F1], [S2]). Total debt figures are not confirmed in the latest quarter filings; the most recent available data from March 2023 indicates low total debt around $15.7 million ([F1]).
| Metric | Value | Date |
|---|---|---|
| Cash & Equivalents | $480.8M | |
| 2026-03-31 | ||
| Current Assets | $1.43B | |
| 2026-03-31 | ||
| Current Liabilities | $247.2M | |
| 2026-03-31 | ||
| Current Ratio | 5.8x | |
| 2026-03-31 |
This analysis is based strictly on information publicly filed with the SEC as of Q1 2026 filings including contemporaneous event reports plus validated company facts data collected through May 6, 2026. It excludes any forward-looking projections not explicitly disclosed by the company.
Disclaimer: This is research-only, informational analysis and not investment advice. It may include AI-generated interpretation and general industry context. Always verify important details using primary sources.
Comments