
Independence Realty Trust's Capital Recycling and Debt Refinancing Shape 2025 Growth Trajectory
IRT's focused multifamily portfolio and value-add initiatives underpin moderate revenue growth offset by tight operational margins and strategic capital deployment.
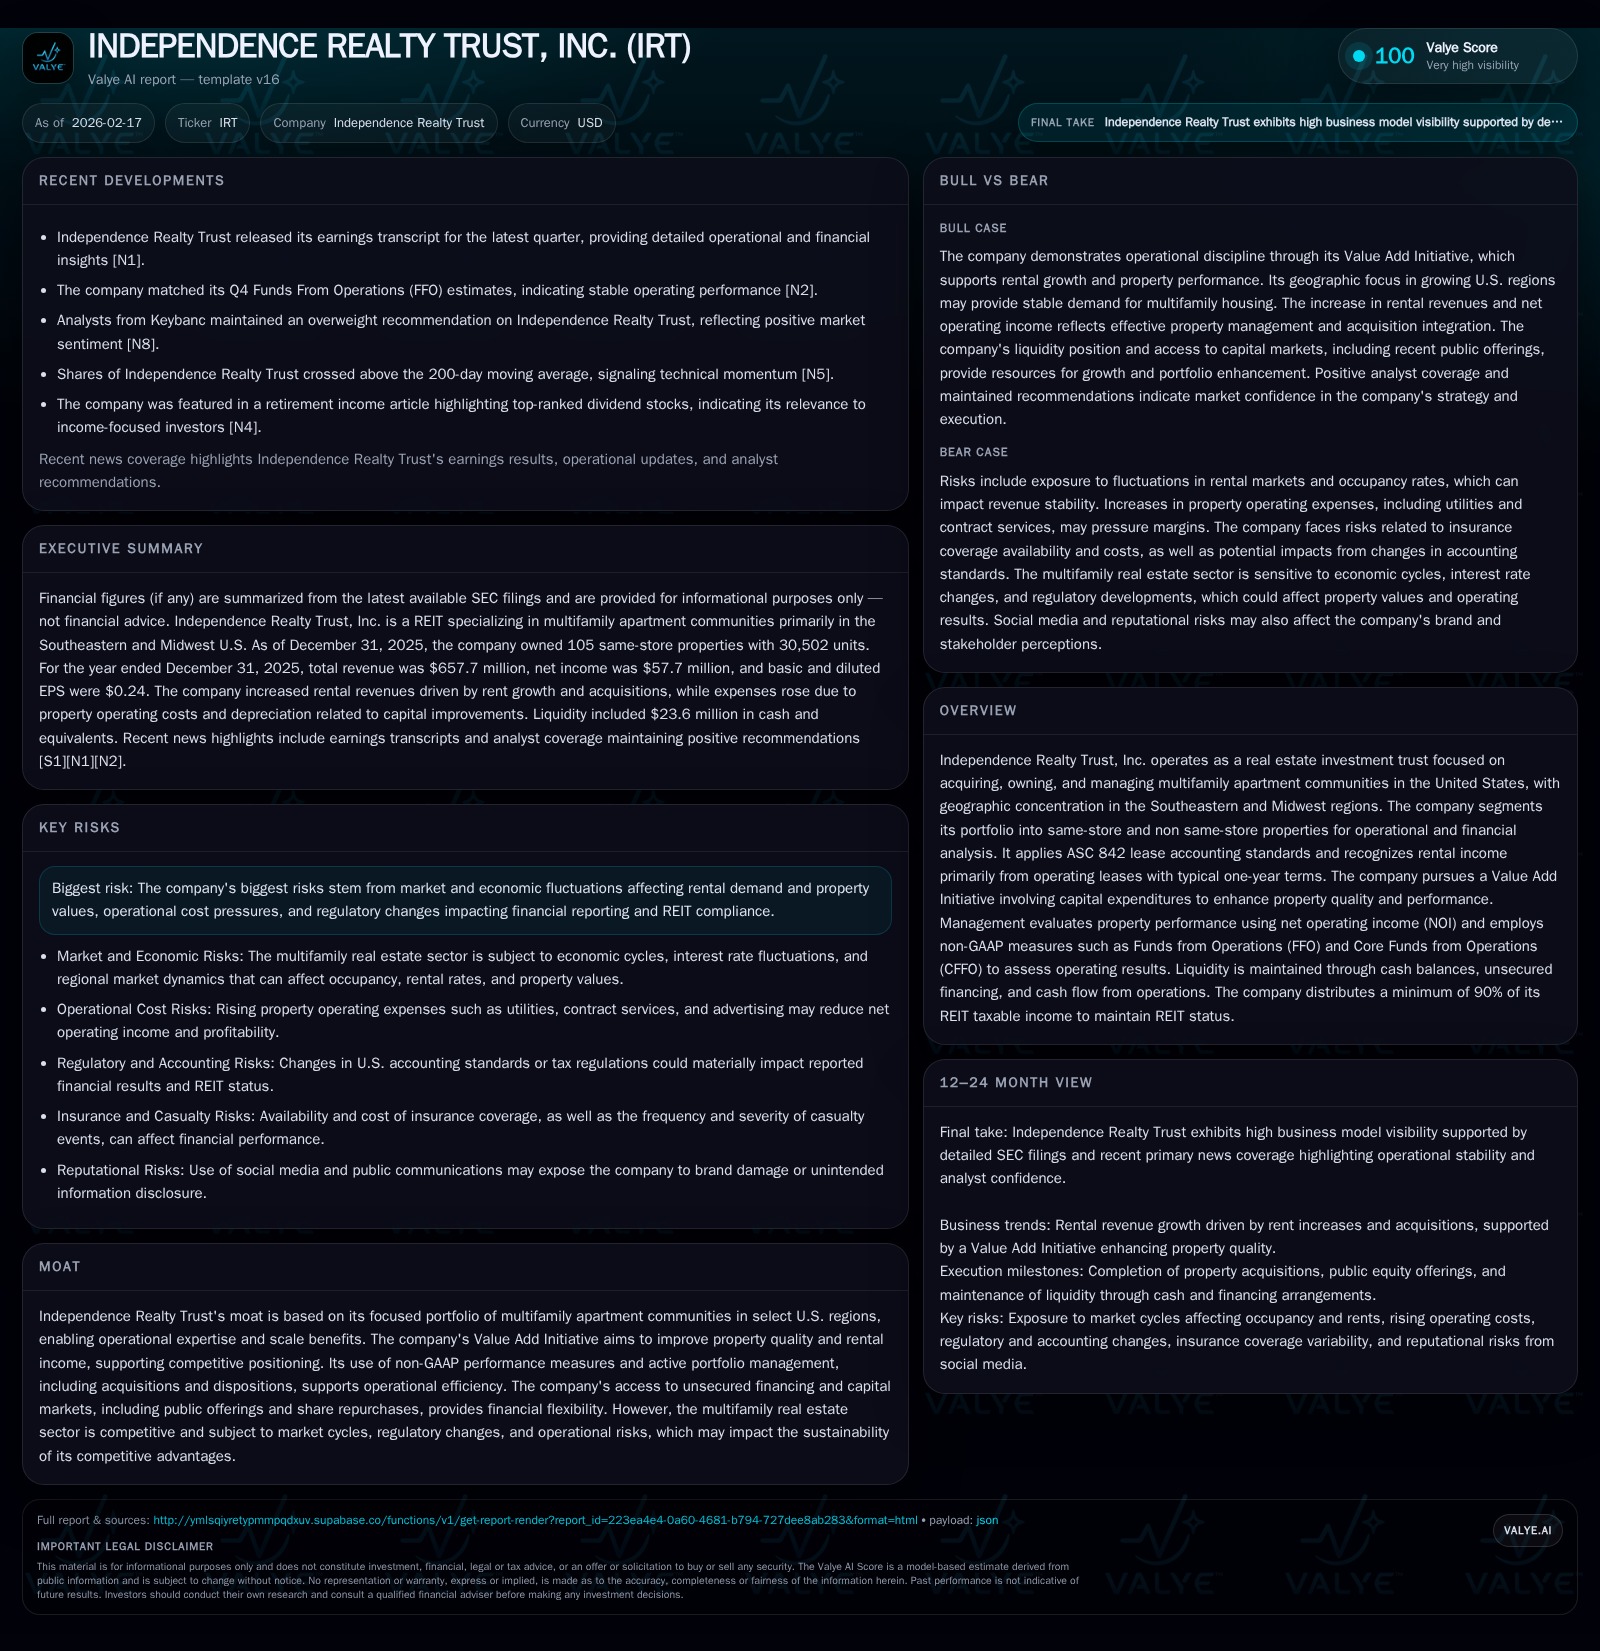
Independence Realty Trust, Inc. operates a geographically concentrated portfolio of multifamily apartment communities primarily in the Southeastern and Midwest U.S. In 2025, the company delivered modest top-line growth with revenues rising 3.8% year-over-year to $167.1 million, driven by same-store performance and acquisitions. Operational efficiency exhibited signs of improvement although net income rebounded from prior losses largely due to one-time effects and disciplined expense management. The company actively pursued a capital recycling strategy while strengthening liquidity through an amended credit facility extending maturities and adding a $350 million term loan. Dividends were consistently paid with meaningful stock repurchases supporting equity returns despite ROE remaining modest at approximately 1%. Going forward, growth hinges on sustaining comparable property NOI gains, successful deployment of value-add capital expenditures, and navigating competitive rental market dynamics in key regions.
Company Overview
Independence Realty Trust, Inc. (IRT) is a Maryland-based real estate investment trust specializing in owning, acquiring, and managing multifamily apartment communities concentrated primarily across the Southeastern and Midwest United States.[S1] Its portfolio management strategy bifurcates assets into same-store properties—those held during consecutive reporting periods—and non same-store properties which include recent acquisitions or dispositions.[S1]
IRT operates through a traditional umbrella partnership REIT (UPREIT) structure where all assets are owned by its operating partnership IROP, of which IRT holds a controlling majority interest.[S1] The company's wholly owned subsidiary, IRT Management, LLC, manages all apartment units owned by IRT—totaling over 33,000 units—as of December 31, 2025.[S22] This vertically integrated property management focuses operational control solely on owned assets rather than third-party portfolios.[S22]
Historical Performance
IRT's revenue demonstrated steady growth over the past four fiscal years from approximately $162.8 million in FY2022 to $167.1 million in FY2025—an aggregate increase driven mainly by rent appreciation at existing properties alongside selective acquisitions.[F1] Revenue remained somewhat consistent in FY2023 but rebounded effectively in FY2024 and FY2025.
Profitability metrics tell a more variable story: net income fluctuated significantly with losses incurred in both FY2023 (-$40.5 million) and FY2024 (-$1.0 million), before returning to positive territory with a net profit of $33.3 million in FY2025[F1]. This swing was facilitated partly by stable operating cash flows and effective cost control measures.
Operating cash flow has been robust, increasing annually from roughly $249.5 million in FY2022 to an estimated $282.1 million in FY2025[F1]. Capital expenditures rose sharply in the most recent period (a doubling compared to prior years), reflecting intensified investments under IRT’s Value Add Initiatives aimed at enhancing property desirability and rental premiums.[F1]
Key Financials Snapshot
Historical performance (annual)
| FY | Rev ($mm) | Net ($mm) | CFO ($mm) | Rev YoY | Net YoY |
|---|---|---|---|---|---|
| 2025 | 167 | 33 | 282 | +3.8% | +3423.2% |
| 2024 | 161 | -1 | 260 | -3.6% | +97.5% |
| 2023 | 167 | -41 | 262 | +2.6% | -220.5% |
| 2022 | 163 | 34 | 250 |
Note: Omitted columns lack sufficient annual XBRL coverage in the provided tags (need ≥2 annual points): OpInc, Capex, Buybacks, FCF. Source: SEC companyfacts cache [F1].
Capital returns and efficiency (annual)
| FY | Div ($mm) | ROE% |
|---|---|---|
| 2025 | 154 | 1.0 |
| 2024 | 144 | -0.0 |
| 2023 | 135 | -1.2 |
| 2022 | 106 | 0.9 |
Source: SEC companyfacts cache [F1].
Note: Capex data fully available only for FY2025; buyback data limited for prior years.
Capital Structure and Liquidity
A critical driver behind IRT's financial strategy is its proactive capital structure management via significant refinancing activity completed in early February 2026.[S4][S5] The Sixth Amended and Restated Credit Agreement expanded debt capacity to $1.5 billion from prior levels with potential future increases up to $2 billion subject to lender commitments.[S4][S5]
This amended agreement introduced a new unsecured term loan tranche of $350 million maturing in February 2030 with an option for a one-year extension.[S4][S5] Proceeds from this term loan were utilized partially to repay the outstanding balance of the earlier maturing May 2026 term loan.[S4]
Outstanding consolidated debt at year-end included approximately $198.9 million drawn under the unsecured revolving credit facility (capacity: $750 million), floating rate unsecured term loans totaling roughly $600 million, fixed-rate secured credit facilities near $582 million, mortgages approximating $739 million, plus unsecured notes aggregating around $150 million[S14][S19]. These borrowings carry weighted average contractual interest rates near mid-4% range with maturities staggered mostly between short- (under 3 years) and medium-term horizons extending beyond seven years depending on instrument type[S14][S19].
Liquidity is supported by unrestricted cash balances close to $23.6 million at end-2025 plus availability under the revolving credit facilities.[F1][S7]
Operational Strategy: Value Add Initiative & Portfolio Management
IRT’s Value Add Initiative emphasizes capital expenditures directed at upgrading property amenities, refurbishing interiors, improving common areas, thereby bolstering rental growth potential and market competitiveness.[S1]
While this approach requires upfront capex investments—reflected in the step-up seen in FY2025—it aims to drive stronger net operating income (NOI) growth over time alongside higher occupancy rates which hovered at an average of about 95% for the same-store portfolio during the latest reporting period.[S7]
Competition arises primarily within densely supplied sub-markets characterized by alternative housing options including condominiums and single-family rentals potentially capping achievable rent increases or squeezing margins if renewal rates must be kept low for retention.[S1]
Dividends and Share Repurchases
Maintaining shareholder distributions is core for REIT status compliance as well as investor appeal; thus IRT declared quarterly dividends increasing slightly from $0.16 per share in early 2024 to $0.17 per share through Q4/25[S6][S16]. Total dividends paid rose accordingly reaching approximately $154 million during FY2025[F1].
Concurrent with dividend payments, IRT pursued a disciplined repurchase program authorized up to $250 million covering open-market purchases as well as privately negotiated transactions[S11][S15]. In CY2025 alone nearly two million shares were bought back at an average cost near $16 per share totaling about $30 million[S6]. This supports offsetting dilution from issuances under ATM equity programs while aiming for accretive shareholder returns.
Returns Metrics
Based on reported figures for FY2025,[F1] IRT’s return on equity (ROE) approximates around 1%, calculated as net income divided by total stockholders' equity at year-end (net income: ~$33M; equity: ~$3.46B). Free cash flow—which can be approximated as operating cash flow minus capital expenditures—is robust at roughly $281.97 million indicating strong underlying cash generation despite modest net income margins.
Explicit detailed figures for other returns such as dividend yield or payout ratio can be derived but are not directly provided within available tags; however, total dividends paid were substantial relative to earnings indicating adherence to REIT distribution requirements.
Risks Overview
Several risk factors may influence IRT’s business outlook including macroeconomic shifts affecting rental demand or resident turnover patterns,[S22] rising operational costs affecting NOI margins,[S22] regulatory environment changes impacting REIT compliance or tax treatment,[S22] as well as financial leverage constraints tied to refinancing risks or covenant limitations embedded within credit agreements[S4][S10][S18].
Operationally there are market headwinds given competitive supply levels especially within some key Southeastern metros where oversupply could pressure rents or slow leasing velocity[S1]. Moreover, any disruptions impacting employee relations or property operations cascaded throughout their vertically integrated management platform could affect resident satisfaction or operational consistency.
Outlook & What To Watch
While explicit multi-year guidance remains unavailable publicly,[N2] watch points include quarterly Funds From Operations (FFO) trends relative to estimates[N2], progress on lease renewals demonstrating sustainable rent growth[N1], capital expenditure pacing relative to realized rent premiums from invested properties[N1], alongside leverage ratios supporting liquidity amid interest rate fluctuations.
Integration progress of recently acquired assets into same-store classification will also indicate portfolio maturation effectiveness along with asset sales activity underpinning capital recycling discipline critical for accretive growth.
Intrinsic regional economic conditions governing employment growth and household formation remain key external demand drivers that can modulate overall occupancy volatility versus forecast assumptions usually maintained internally at conservative levels.
Conclusion
Independence Realty Trust navigated an incremental growth phase through calibrated revenue improvements backed by value-add capex deployments while managing debt maturities proactively via sizable refinancing actions extending weighted average maturity profiles. The coexistence of steady dividend support alongside active share repurchases highlights an effort toward balanced capital allocation aimed at sustaining investor confidence amid sector-competitive pressures. However, challenges related primarily to maintaining NOI expansion amid evolving regional rental market dynamics alongside financing covenant discipline warrant ongoing surveillance for operational resilience. The company's strategic positioning through regional concentration offers scale benefits but necessitates careful navigation through localized economic cycles offering both opportunity levers and risk checkpoints.
This analysis is based on publicly available financial statements filed with the SEC as of February 17, 2026 [F1],[S#], recent earnings disclosures[N#], industry context analysis and does not constitute investment advice or recommendations.
Disclaimer: This is research-only, informational analysis and not investment advice. It may include AI-generated interpretation and general industry context. Always verify important details using primary sources.
Comments