
Ingersoll Rand Leverages Diverse Portfolio Amid Shifting Industrial Demand
Ingersoll Rand’s extensive product line and aftermarket focus underpin cash flow stability despite market and operational challenges.
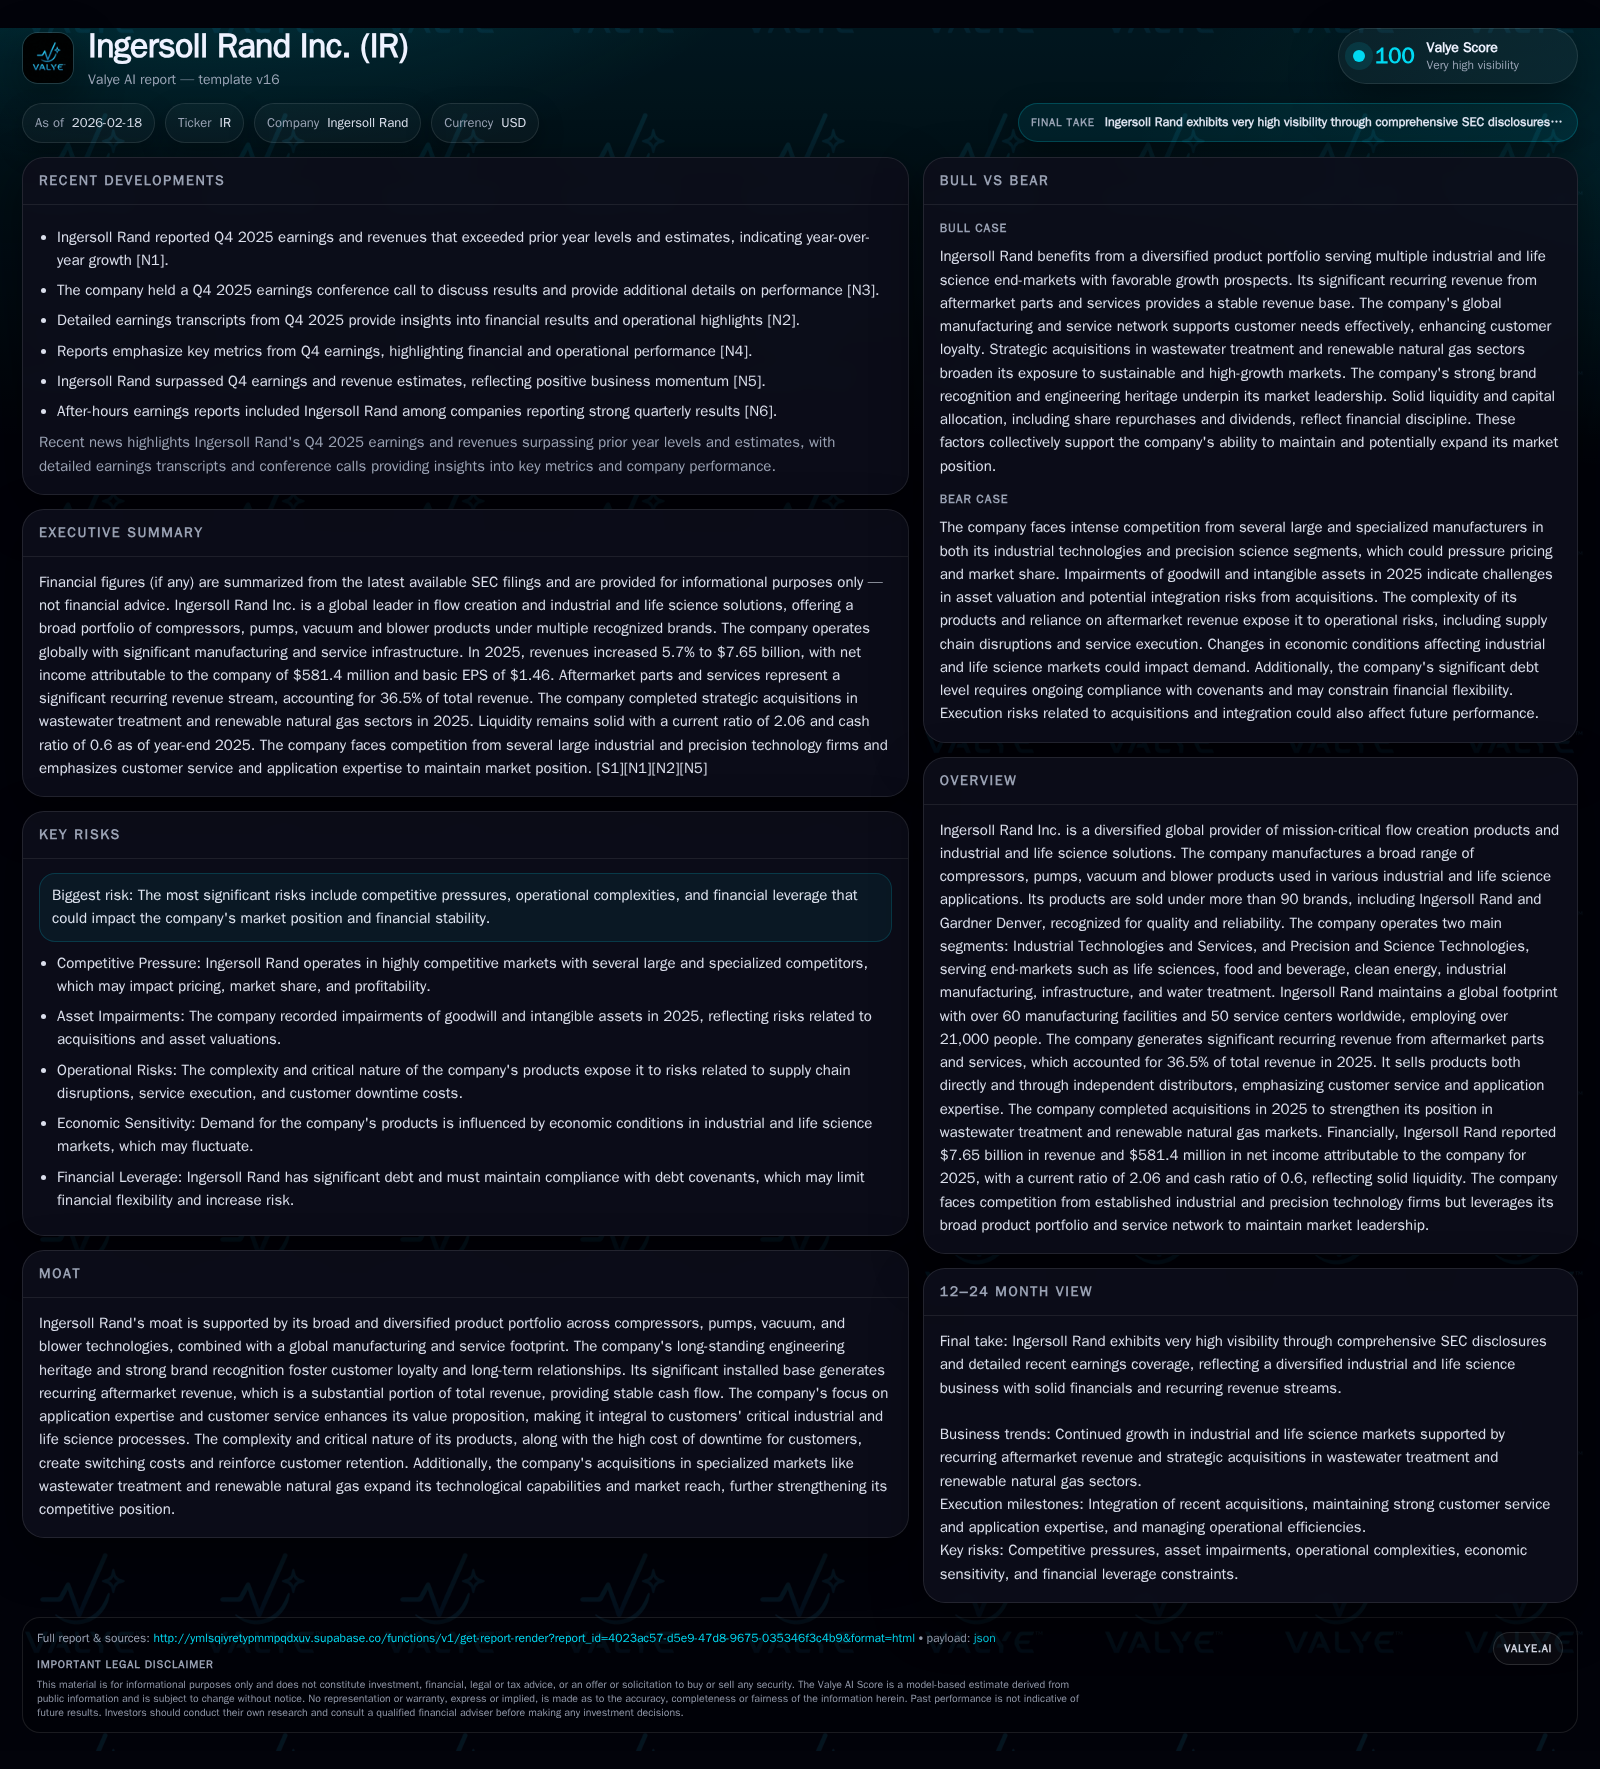
Ingersoll Rand Inc. sustains its position as a global leader in flow creation products with over 165 years of engineering heritage, leveraging a broad portfolio spanning compressors, pumps, vacuum, and blower technologies. The company benefits from a significant installed base that drives ~36.5% of revenue from high-margin aftermarket parts and services, supporting recurring cash flow amidst evolving industrial demand patterns. While operating income declined by 12% year-over-year in 2025, the company’s cash flow from operations rose sharply by 48%, enabling accelerated share repurchases and stable dividends. Segment diversification across Industrial Technologies and Precision & Science Technologies diversifies cyclical exposure, but operational complexities, raw material inflation, and competitive pressures remain key considerations.
Legacy of Engineered Solutions: Historical Growth and Revenue Drivers
Ingersoll Rand Inc. has built its reputation over more than 165 years as a stalwart provider of engineered flow creation products critical to many industrial processes globally. Its expansive portfolio spans compressors, pumps, vacuum systems, and blowers sold under over 90 well-recognized brands such as Ingersoll Rand itself and Gardner Denver [S1]. This rich heritage fosters strong brand loyalty and deep customer relationships.
The company recorded revenues of approximately $7.65 billion in fiscal year (FY) 2025, up from $7.24 billion the prior year, signaling robust volume and pricing contributions across its segments [F1][S11]. Operating income dipped to $1.14 billion in 2025 from $1.3 billion in 2024, reflecting margin pressure associated with raw material cost inflation (notably steel and aluminum) and operational complexities [F1][S25]. Net income followed suit with a sharper decline to $581 million from $839 million year-over-year (y/y), influenced also by higher restructuring charges [F1][S21]. Nevertheless, the company demonstrated strong cash generation capability with net operating cash flow climbing to $1.36 billion — a rise of nearly 48% y/y — showcasing disciplined working capital management [F1].
Historical performance (annual)
| FY | Net ($mm) | OpInc ($mm) | Capex ($mm) | Net YoY |
|---|---|---|---|---|
| 2025 | 581 | 1145 | 136 | -30.7% |
| 2024 | 839 | 1300 | 149 | +7.7% |
| 2023 | 779 | 1164 | 105 | +28.8% |
| 2022 | 605 | 817 | 95 |
Note: Omitted columns lack sufficient annual XBRL coverage in the provided tags (need ≥2 annual points): Rev, CFO, FCF. Source: SEC companyfacts cache [F1].
Capital returns and efficiency (annual)
| FY | Div ($mm) | Buybacks ($mm) | ROE% |
|---|---|---|---|
| 2025 | 32 | 1018 | 5.8 |
| 2024 | 32 | 261 | 8.2 |
| 2023 | 32 | 263 | 8.0 |
| 2022 | 32 | 261 | 6.6 |
Source: SEC companyfacts cache [F1].
Note: Revenue data for FY2017 available but omitted here for brevity; Operating Income and Net Income reflect recent trends clearly [F1].
Aftermarket Revenue: The Backbone of Recurring Cash Flows
A defining feature of Ingersoll Rand’s business model is its extensive installed base which generates substantial recurring revenue streams through aftermarket parts, consumables, and services that represented approximately 36.5% of total Company revenue in FY25 [S7]. This mix imparts margin stability amidst industrial demand cyclicality since customers face high switching costs given the mission-critical nature of these products whose downtime carries high operational penalties.
Installed base economics are particularly prominent within compressor technologies where maintenance cycles extend typically over a decade with multiple service intervals requiring genuine application expertise for servicing [S22]. Similarly, tailored fluid handling pumps and vacuum products benefit from ongoing consumables demand incentivizing customer retention through technical support and efficient parts availability.
Service centers numbering over fifty globally complement more than sixty manufacturing facilities ensuring rapid deployment of replacement parts thereby minimizing customer downtime – a crucial value proposition maintaining high aftermarket penetration [S7][S22]. Competitors often find replicating this integrated service network challenging given capital intensity and required technical depth.
Recent Operational Performance: Analyzing Q4 '25 in Context
The fourth quarter of fiscal year 2025 (Q4 '25) saw Ingersoll Rand beat earnings expectations despite margin pressure highlighting operational resilience [N1][N5]. Revenues grew y/y across both segments; however, net income contracted reflecting transient cost headwinds [N14]. Management commentary highlighted solid volume growth balanced against raw material inflation with ongoing investments into cost efficiency programs outlined on the earnings call [N2].
Segment contributions remained consistent with Industrial Technologies driving the bulk of revenue while Precision & Science Technologies continued margin robustness attributed to high-value medical/lab oriented products [N4][N5][N14]. Despite headwinds, incremental gains in aftermarket sales supported overall revenue growth affirming consistent client demand.
Market End-Markets & Segmentation: Industrial Technologies vs Precision Sciences
Ingersoll Rand operates two core segments:
- Industrial Technologies & Services (ITS): Generating ~$6.06 billion revenue in FY25 mainly through air/gas compressors, vacuum/blower products, fluid transfer equipment sold under brands like Gardner Denver and Nash [S11],[S23]. ITS caters primarily to industrial manufacturing, infrastructure, clean energy projects where capital spending cycles dictate demand variability.
- Precision & Science Technologies (PST): Delivering ~$1.59 billion revenue focused on specialized liquid/solid dosing pumps and life science tools including single-use powders/systems used extensively in healthcare labs under brands like Milton Roy and ILC Dover [S11],[S23]. PST enjoys relatively lower cyclicality driven by expanding healthcare infrastructure globally.
Geographically diverse with strong presence across Americas (50%), EMEIA (34%), and Asia Pacific (~16%) markets ensures varied exposure to macroeconomic factors mitigating regional risks [S23]. PST’s focus on medical/laboratory applications provides natural hedge versus ITS industrial cyclicality.
Navigating Growth Constraints: Competitive Pressures and Operational Complexities
Stiff competition pervades Ingersoll Rand’s served markets including from Atlas Copco, Flowserve on compression side; Dover and Graco compete strongly in precision technologies [S14][S24]. Price discipline combined with technology differentiation pose continual challenges.
Operational complexity arises given raw materials like steel and aluminum form substantial input costs subject to global volatility impacting cost absorption capabilities as noted in recent filings [S25][S28]. Manufacturing footprint spanning multiple continents compounds supply chain coordination demands alongside compliance with environmental regulations adding incremental cost layers [S13][S28].
Despite these hurdles, robust engineering expertise coupled with global distribution networks maintain competitive moats but require diligent execution amidst global economic uncertainties.
Evolving Capital Allocation: Share Buybacks, Dividends, and Investment Priorities
Capital allocation strategy has become increasingly favorable towards shareholders evidenced by aggressive share repurchases totaling approximately $1.02 billion in FY25 — nearly quadruple the buybacks undertaken in FY24 ($260 million) — underscoring confidence supported by strong free cash flow generation ($1.22 billion calculated as CFO minus capex) [F1][S26].
Dividend payments remained steady at around $32 million indicating a modest payout ratio relative to earnings allowing retained earnings for reinvestment or acquisitions if opportunities arise [F1][S26]. Capital expenditures exhibited a slight downtrend (-9%) possibly reflecting efficiency initiatives or cautious investment posture amid market dynamics [F1].
This balanced deployment highlights a focus on maximizing shareholder returns without foregoing necessary investments into technology upgrades or capacity expansions critical for sustaining future competitiveness.
Financial Structure and Liquidity Setup for Strategic Flexibility
As of December ‘25 end, liquidity stood robustly supported by approximately $1.25 billion cash on hand complemented by an undrawn revolving credit facility capped at $2.6 billion enabling ample headroom for working capital needs or strategic acquisitions [S4][S5][S6].
Debt maturities appear manageable within current operating cash flow profiles with adherence to covenants affirmed throughout FY25 indicating no immediate refinancing pressures despite elevated leverage levels reflective of prior acquisition funding strategies [S8][S9].
Cost of capital management benefits from term SOFR-linked credit arrangements offering rate variability aligned with market conditions minimizing financing costs during favorable interest cycles [S5].
What to Watch: Key Metrics and Strategic Catalysts Ahead
Investors should track upcoming quarterly results focusing on:
- Aftermarket revenue growth momentum as key indicator of installed base health.
- Operating margin trends reflecting success in managing input cost inflation.
- Debt leverage ratios signaling deleveraging progress or capacity for further buybacks/acquisitions.
- Any guidance revisions or strategic disclosures on potential bolt-on acquisitions targeting niche precision technologies or geographic expansion.
- Developments related to supply chain stabilization that could materially impact gross margins or delivery timelines.
- Return on equity trajectory given current earnings trends.
- Dividend sustainability alongside share repurchase activity amid cash flow dynamics.
These factors will collectively shape IR’s resilience profile amid evolving industrial capital spending cycles poised between renewed infrastructure activity and cautious manufacturing investment sentiment globally.
Disclaimer: This analysis is based solely on publicly available information as of February 2026 without any forward-looking investment advice or recommendations.
Disclaimer: This is research-only, informational analysis and not investment advice. It may include AI-generated interpretation and general industry context. Always verify important details using primary sources.
Comments