
Invesco Mortgage Capital’s Earnings Surge and Capital Strategy Signal Renewed Stability
Financial turnaround highlights better credit conditions and strategic leverage management in a volatile mortgage REIT sector.
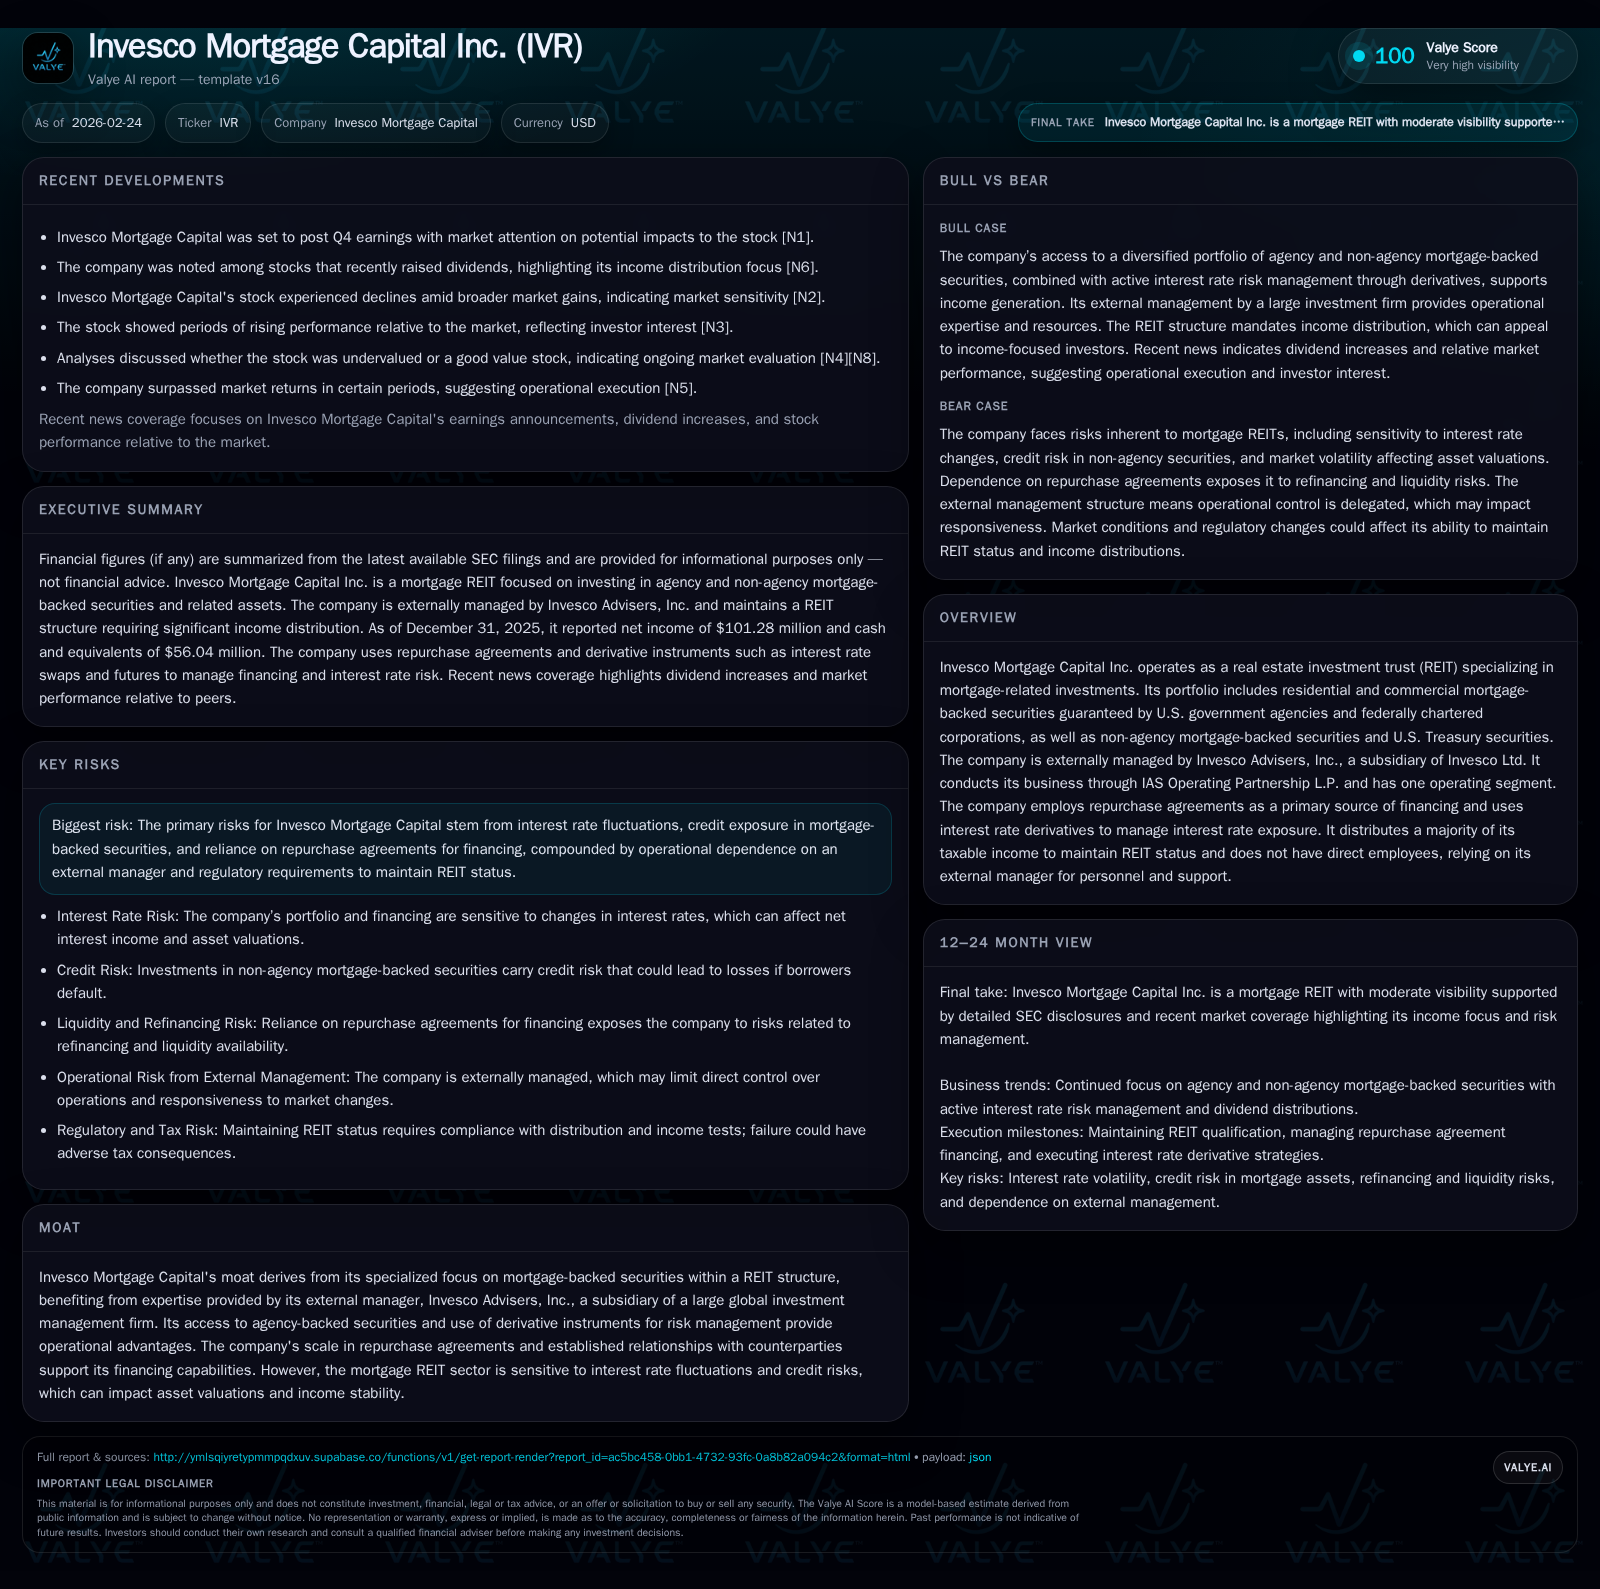
Invesco Mortgage Capital Inc. (IVR) reported a strong net income of $101 million in fiscal 2025, reversing losses from recent years amid improved market and credit dynamics. The company’s portfolio remains concentrated in agency-backed mortgage-backed securities (MBS), supported by robust risk management through derivatives and repurchase agreement financing. Despite a decrease in operating cash flow, IVR maintains prudent capital allocation including preferred stock buybacks and consistent dividends, underpinned by an estimated return on equity (ROE) near 12.7%. Forward-looking indicators suggest the company’s earnings stability is closely tied to interest rate fluctuations and credit conditions within the mortgage REIT landscape.
From Losses to Profit: IVR's Historic Financial Turnaround
Invesco Mortgage Capital Inc. registered a dramatic financial improvement over the recent three-year period. From a severe net loss of approximately $403 million in fiscal year 2022, IVR returned to profitability with $59.9 million in 2024 and surged further to $101.3 million net income in 2025 [F1]. This trajectory serves as a case study in recovering mortgage REITs leveraging market dislocations to reposition portfolios.
The substantial swing stems primarily from improved credit spreads for agency pass-through securities and better hedging effectiveness via derivative instruments. The prior steep losses incorporated sharp markdowns on non-agency exposures amid volatile housing credit markets, while recent performance points to enhanced portfolio quality and more favorable macroeconomic conditions [S1][N1].
This profitability inflection contrasts sharply with prior years’ earnings volatility inherent across mortgage REITs exposed to changing interest rates and credit risk premiums.
Portfolio Composition Driving Performance: Agency vs. Non-Agency MBS
IVR's investment strategy remains focused chiefly on agency-backed residential mortgage-backed securities (RMBS) and commercial mortgage-backed securities (CMBS) guaranteed by U.S. government agencies like Ginnie Mae, Fannie Mae, and Freddie Mac [S2]. As of September 2025, agency RMBS accounted for the majority of principal balance at fair value exceeding $4.7 billion, with agency CMBS contributing nearly $900 million [S9][S27].
This portfolio mix benefits from relatively low credit risk due to government guarantees, lending income stability even under interest rate fluctuations.
Non-agency RMBS and CMBS holdings are comparatively limited, minimizing exposure to credit spread widening—a notable advantage during tightening cycles or economic uncertainty [S2][F1]. The presence of U.S Treasury securities also adds incremental liquidity buffer.
The composition favors pass-through agency pools with fixed-rate coupons that hedge well against prepayment volatility when paired with interest rate swaps.
Leverage, Derivatives, and Repurchase Agreements: Managing Risk and Liquidity
IVR leverages repurchase agreement financing extensively to fund its portfolio—standard within mortgage REIT operations—maintaining collateral coverage ratios consistently around 105% as of late 2025 [S9]. Collateral pledged primarily consists of agency RMBS and CMBS currently valued at approximately $5.38 billion supporting borrowings near $5.15 billion [S9][S11].
The company's derivative positions focus heavily on centrally cleared interest rate swaps executed via CME clearinghouses designed to stabilize funding costs amid rising or volatile SOFR rates. Swap notional outstanding totaled approximately $3.38 billion at a weighted average fixed payment rate near 1.08% versus floating receipt at about 4.24%, creating an effective hedge against interest expense shocks [S10][S11].
Margin call risk remains managed through vigilant collateral monitoring; retained non-cash collateral on balance sheet is minimal due to robust counterparty controls.
Repo maturities stay short-term (1–6 months), allowing IVR flexibility to refinance as market conditions evolve but exposing the trust to roll-over risks if liquidity tightens unexpectedly.
Capital Allocation Priorities: Dividends, Preferred Stock Buybacks, and External Management Costs
Capital deployment underlines maintenance of REIT status through mandatory distributions representing over 90% of taxable income annually; common stock dividends have remained steady even as sector pressures mount [S6][F1]. Preferred stock repurchases continue selectively—276 thousand shares retired year-to-date in 2025—indicating strategic efforts to optimize equity cost while reducing fixed dividend obligations [S6].
External management fees paid to Invesco Advisers reflect typical costs associated with externally managed mortgage REITs—approximately $8.5 million incurred over nine months ending September 2025—tied directly to stockholders' equity values [S6][F1]. Administrative expense control contributes positively toward available distributable income despite reliance on external personnel rather than internal employees.
The mix underscores a balancing act between returning capital regularly while managing expenses unique to externally managed structures that differ from internally managed peers.
CFO Trends and Equity Returns: Interpreting ROE in a Mortgage REIT Context
Operating cash flow has exhibited some contraction recently, falling by roughly 14% from approximately $183 million in fiscal 2024 down to $157 million in fiscal 2025 despite rising net income results [F1]. This divergence commonly reflects accounting timing differences such as realized/unrealized gains recognition on MBS sales or derivative settlements which can accelerate reported earnings without immediate cash effect.
Total stockholders’ equity edged upward by around 9% year-over-year reaching nearly $798 million by end-2025 supporting an approximate ROE calculation near 12.7%, a figure well within typical mortgage REIT ranges that blend moderate leverage with variable asset yields under current rates regimes [F1].
Liquidity remains ample with cash balances above $56 million plus restricted cash buffers exceeding $120 million ensuring capability for margin calls or opportunistic portfolio maneuvers [S21].
Historical performance (annual)
| FY | Net ($mm) | CFO ($mm) | Net YoY |
|---|---|---|---|
| 2025 | 101 | 157 | +69.1% |
| 2024 | 60 | 183 | +477.6% |
| 2023 | -16 | 238 | +96.1% |
| 2022 | -403 | 196 |
Note: Omitted columns lack sufficient annual XBRL coverage in the provided tags (need ≥2 annual points): Rev, OpInc, Capex, Div, Buybacks, FCF. Source: SEC companyfacts cache [F1].
Capital returns and efficiency (annual)
| FY | ROE% |
|---|---|
| 2025 | 12.7 |
| 2024 | 8.2 |
| 2023 | -2.0 |
| 2022 | -50.1 |
Source: SEC companyfacts cache [F1].
Analyzing Forward Signals: What Q4 Earnings and Recent Market Moves Suggest
Market commentary over early 2026 positions IVR within a cautious yet improving narrative. While shares experienced notable volatility reflecting broader sector sensitivity to Fed policy signals and repo funding dynamics ([N2], [N3]), investors have responded positively at times appreciating the shift toward consistent profitability ([N3]). Questions about valuation given interest rate headwinds surfaced yet remain open pending upcoming Q4 results expected late January ([N1]).
Stock price movements indicate ongoing investor wariness about leverage-induced risks but also suggest recognition of IVR’s strategic emphasis on high-quality agency MBS assets supported by hedging efficacy ([N4]). Close monitoring will be required regarding repo spreads, potential margin calls linked with derivative positions, and shifts in prepayment expectations that may impact earnings stability going forward.
Generally, IVR’s forward outlook reflects a classic mortgage REIT profile balancing macro risk sensitivity against measured capital management anchored by agency MBS dominance.
Disclaimer: This analysis is based solely on publicly available data from SEC filings up through February 23, 2026, related news reports, and company disclosures. It is intended for informational purposes only without any recommendation or solicitation for investment.
Disclaimer: This is research-only, informational analysis and not investment advice. It may include AI-generated interpretation and general industry context. Always verify important details using primary sources.
Comments