
JBS N.V.'s Revenue Surge and Strategic Expansion in Global Proteins
JBS has leveraged its vast scale, diverse brand portfolio, and geographic footprint to accelerate revenue growth and solidify leadership amidst rising regulatory challenges.
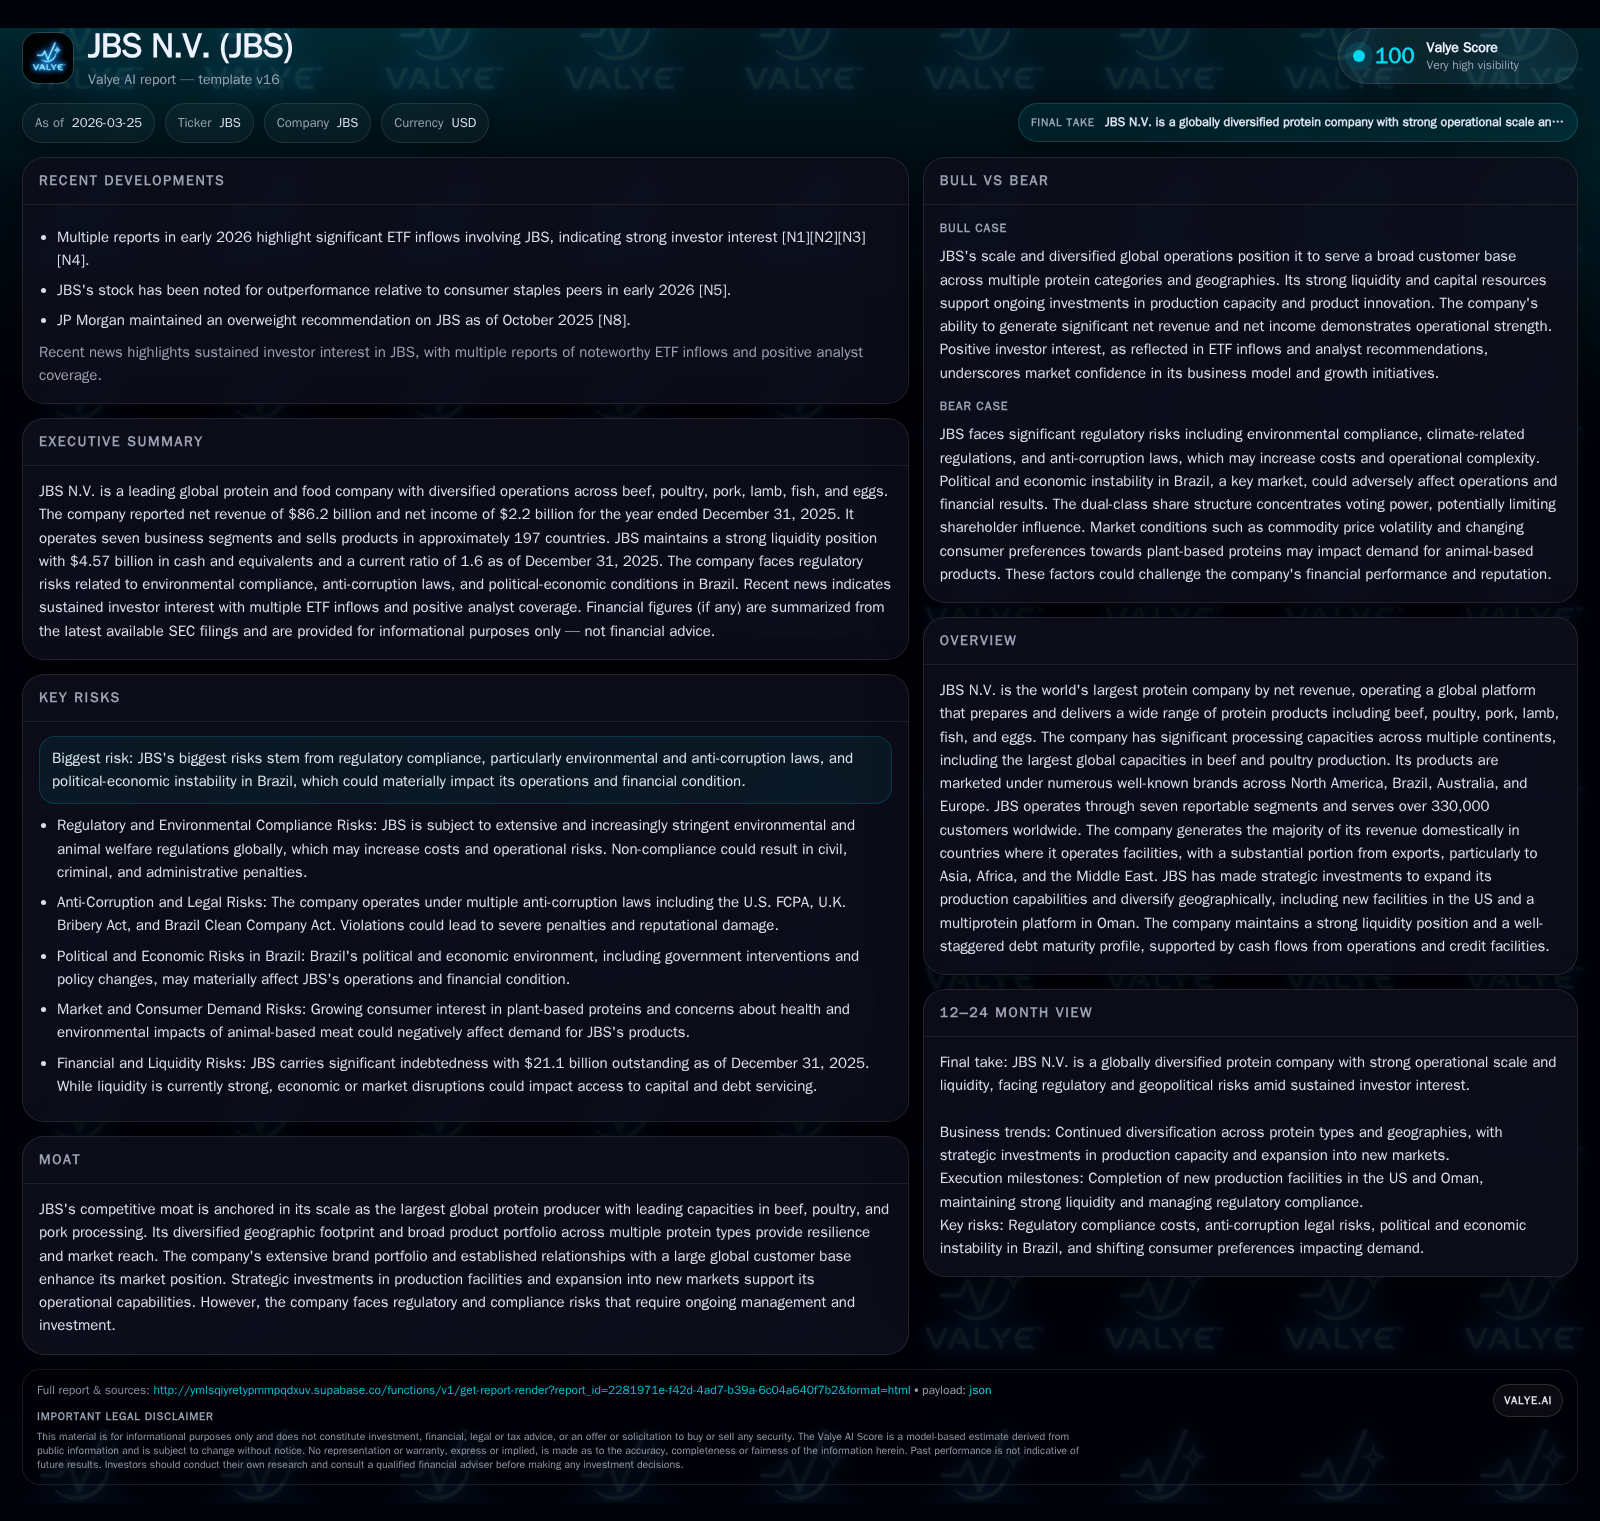
JBS N.V. emerged as the world’s largest protein producer by revenue in 2025, achieving a strong rebound from a 2023 net loss to multi-billion dollar profits. This transformation reflects strategic capacity expansions, geographic diversification, and a broad product lineup spanning beef, poultry, pork, lamb, fish, and eggs. The company maintains a strong liquidity position with disciplined capital allocation balancing facility investments and debt management, while facing evolving environmental and regulatory compliance costs.
Financial Performance: From Loss to Profitability
JBS N.V. demonstrated a robust recovery from a net loss of approximately $0.1 billion in 2023 to net incomes of $2.0 billion in 2024 and $2.2 billion in 2025 based on consolidated annual financials [F1]. This improvement was supported by an increase in net revenue from about $72.9 billion in 2023 to $86.2 billion in 2025 — an approximate 18% rise reflecting both organic growth and acquisitions expanding its protein portfolio including beef, poultry, pork, lamb, fish, and eggs [F1][S1]. Adjusted EBITDA nearly doubled over this timeframe from $3.5 billion to $6.8 billion indicating enhanced operating leverage through scale efficiencies across its integrated processing and distribution network [F1][S1].
Leading Global Protein Producer by Capacity
As of December 31, 2025, JBS maintained top rankings globally for protein processing capacities:
- #1 global beef processor with daily capacity exceeding 78,000 heads across operations in the U.S., Brazil, Australia, and Canada;
- #1 global poultry processor with aggregate daily slaughter above 14 million chickens distributed across North America, Brazil, Europe (including UK), Mexico, Puerto Rico;
- #2 largest pork processor globally with daily capacity over 149 thousand hogs;
- Leading lamb processor with daily capacity over 23,500 heads primarily in Australia and Europe;
- Regional leader in fish processing with about 200 tons daily throughput centered on Australian operations;
- Brazilian table egg production approaching approximately four billion eggs annually from six states.
This extensive processing scale supports supplier power advantages within protein supply chains while enabling cost efficiencies crucial for maintaining margins amid input price volatility [S1].
Geographic Revenue Breakdown
In fiscal year ending December 31, 2025 [S4][S9]:
Historical performance (annual)
| FY |
|---|
| 2025 |
Source: SEC companyfacts cache [F1]. 103.3% (includes intercompany elimination)
Domestic sales represented approximately 74% of total net revenue whereas export sales constituted roughly 26%, with Asia accounting for half of export revenues primarily via China, Japan and South Korea; Africa and the Middle East combined contributed about 12% of exports [S4][S9].
Brand Portfolio Supporting Market Penetration
JBS markets products under numerous regional brands facilitating penetration into retail supermarkets as well as foodservice customers worldwide [S1][S14], examples include:
- North America: Swift, Just Bare, Pilgrim’s Pride;
- Brazil: Seara (flagship), Friboi premium lines like Black Friboi & Seara Gourmet;
- Australia/New Zealand: Rivalea, Huon Salmon & Beehive eggs;
- Europe/UK: Moy Park poultry products.
This diversified brand presence enables pricing flexibility and customer loyalty across more than 330,000 customers spanning approximately 197 countries on six continents [S1].
Capital Allocation & Liquidity Positioning
As of December 31, 2025 [F1][S13]:
- Cash & cash equivalents stood at approximately $4.6 billion.
- Total outstanding debt was around $21.1 billion composed mainly of non-current loans.
- Current assets ($18.4 billion) exceeded current liabilities ($11.5 billion) yielding a current ratio of approximately 1.6x.
- Additional borrowing capacity under revolving credit facilities totaled near $3.5 billion unused.
Capital expenditures exceeded $2 billion focusing on facility modernization and capacity expansions aligned with strategic priorities including specialty plants such as an Italian pepperoni facility planned for South Carolina [S13][S28]. The company maintains compliance with all financial covenants under revolving credit agreements ensuring covenant flexibility barring unforeseen circumstances [S13]. Return on equity stood near an estimated ~17.6%, evidencing effective capital utilization based on reported net income relative to equity balances [F1].
Regulatory Environment & Risks
JBS faces evolving regulatory landscapes particularly related to environmental compliance costs driven by climate-related disclosure mandates finalized by the SEC in March 2024 which require greenhouse gas emissions reporting among other climate risk disclosures—though timelines remain subject to legal challenge [S25]. Additional compliance burdens arise from animal welfare regulations and anti-corruption laws increasing administrative oversight demands or litigation risks if not managed effectively [S25]. Political-economic instability within Brazil also presents operational risk requiring active mitigation given the country’s significant contribution to revenues .
Outlook & Monitoring Points for Investors
Key indicators for ongoing monitoring include:
- Adjusted EBITDA margin trends post-completion of recent expansion initiatives including the multiprotein hub announced for the Middle East region expected to drive export growth beyond established Asian markets [S3][N1][N2];
- Sustained export sales performance amid currency fluctuations or trade tensions impacting profitability;
- Implementation progress of enhanced climate-related disclosures influencing capital expenditure versus operating cost allocations;
- Developments regarding political-economic conditions affecting Brazilian operations given their sizable revenue weighting;
- Market sentiment reflected through ETF inflows highlighting investor confidence in JBS’s growth prospects ([N1], [N2]).
Disclaimer: This analysis is based solely on publicly available filings ([F1], [S#]) and news reports ([N#]) as of March 25th, 2026 without any speculative forecasts or investment recommendations.
Disclaimer: This is research-only, informational analysis and not investment advice. It may include AI-generated interpretation and general industry context. Always verify important details using primary sources.
Comments