
KinderCare Learning Companies Confronts Funding and Liquidity Challenges Post CEO Transition
KinderCare reports Q1 2026 operational results highlighting leadership changes, liquidity stress, and funding dependencies shaping its near-term trajectory.
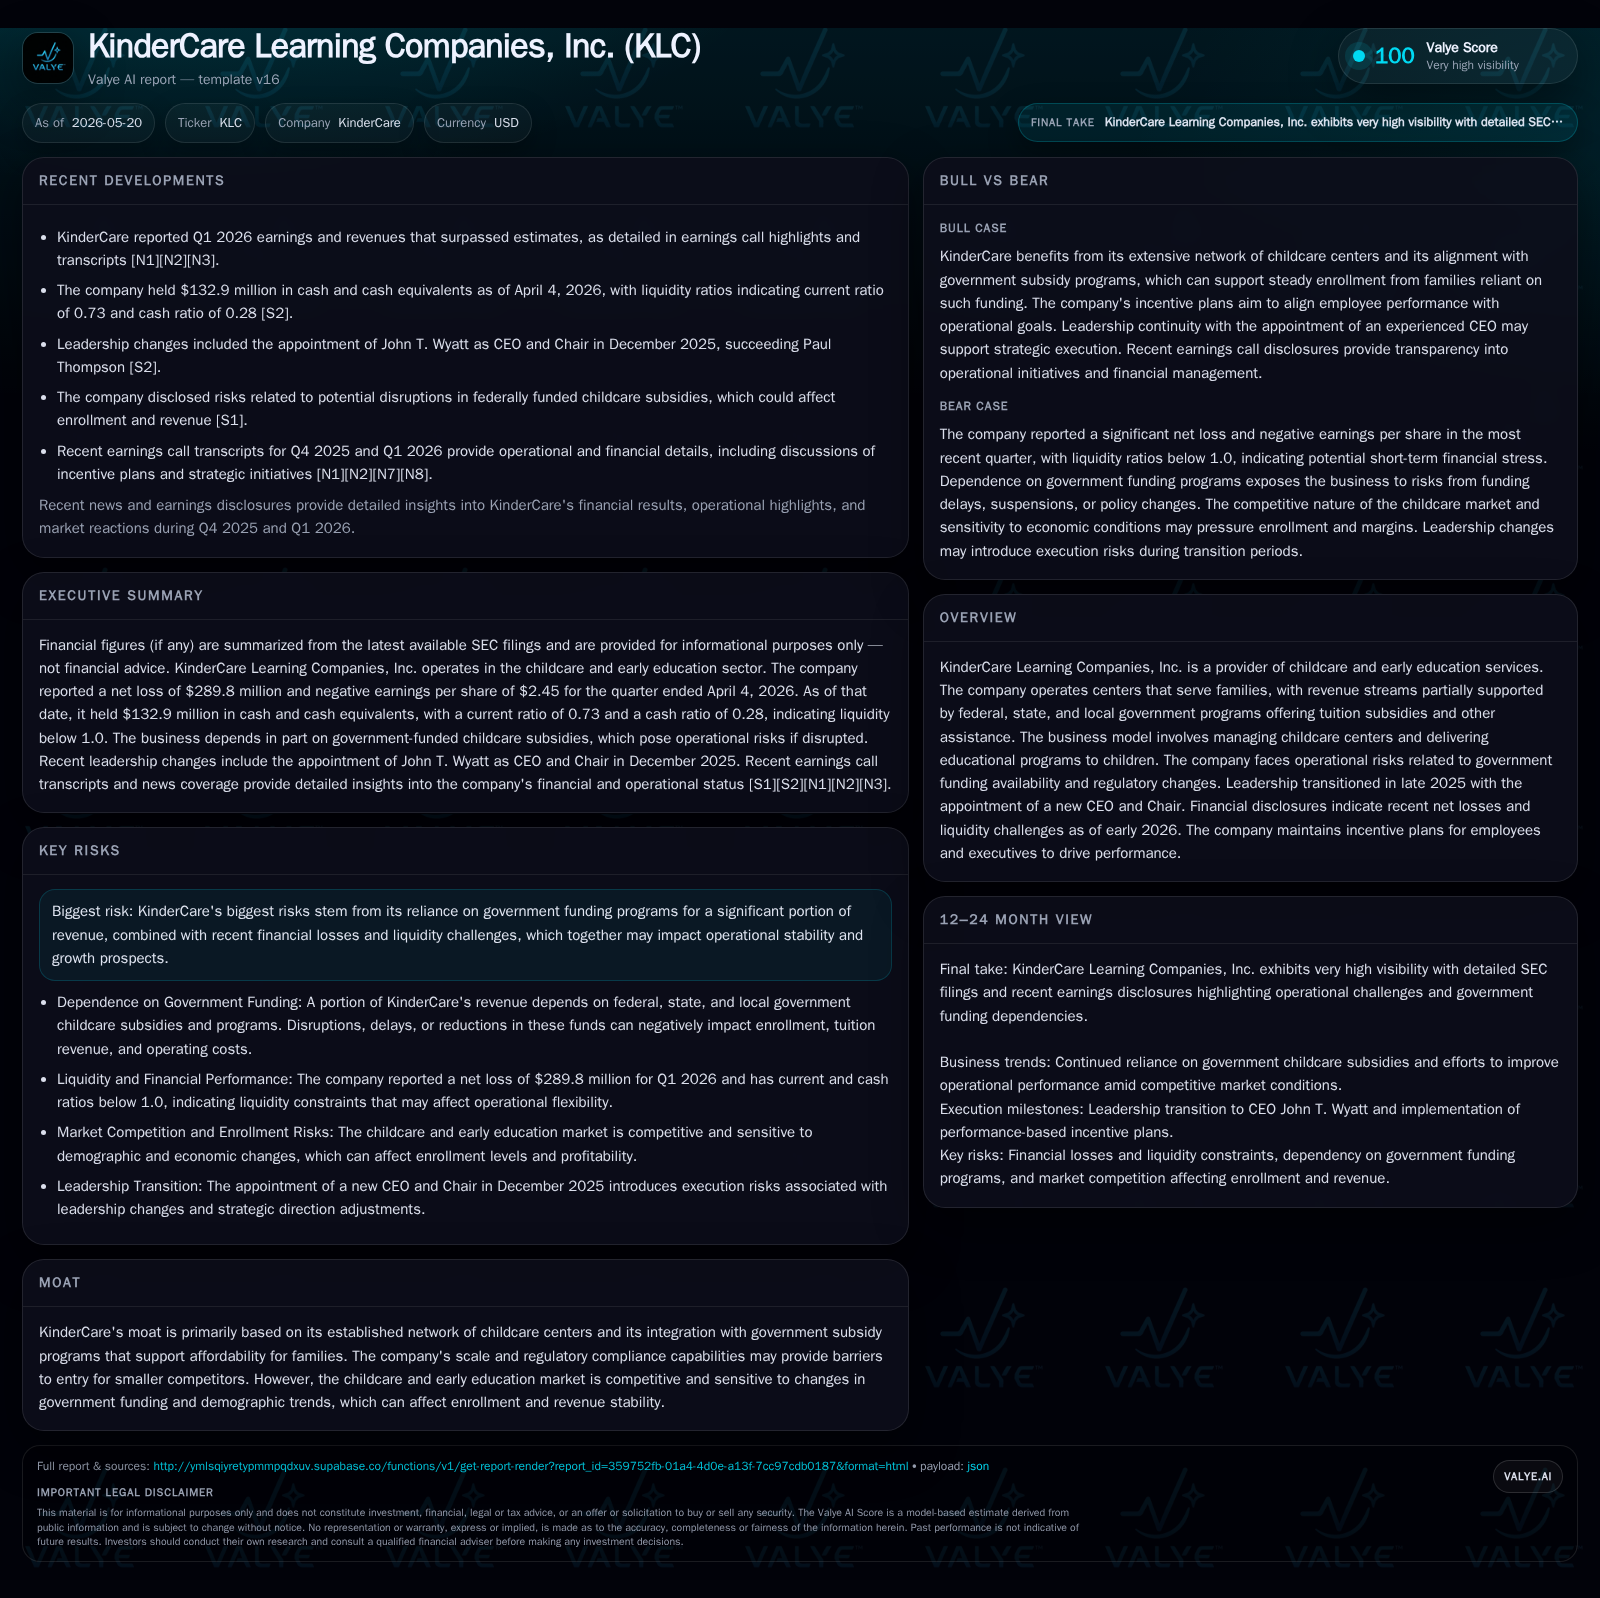
KinderCare Learning Companies’ first quarter 2026 earnings reveal continued net losses and liquidity constraints against a backdrop of a recent CEO transition. The company operates a large network of childcare centers funded partly by government subsidy programs, which underpin both demand and pricing flexibility but also expose it to regulatory and funding risk. KinderCare’s market position benefits from scale and integration with subsidy frameworks, though competitive pressures and funding volatility present growth challenges. Performance will hinge on enrollment trends, subsidy stability, and operational efficiency under new leadership execution.
Latest Quarterly Operating Results and Leadership Update
KinderCare Learning Companies released its Q1 2026 operating update through an SEC 10-Q filing dated May 14, 2026 [S2] alongside an 8-K current event announcement [S3]. Cash and equivalents stood at approximately $133 million against total debt near $927 million, resulting in an estimated net debt position of around $794 million as of April 4, 2026 [F1]. These figures underscore ongoing balance sheet stress.
Simultaneously, KinderCare completed a critical leadership transition with John T. Wyatt assuming roles as CEO and Chair in late 2025 [S24], confirmed by the CEO certification attached to the Q1 filings [S18]. This fresh executive stewardship aims to steer the company through its operational challenges.
Financial disclosures align with recent earnings call highlights that posted revenue barely exceeding estimates but accompanied by sustained operating losses [N3]. The earnings transcript reveals heightened focus on navigating funding headwinds amid efforts to stabilize operations through improved center efficiency and client engagement protocols [N1].
KinderCare's Business Model: Revenue Streams and Service Quality Dynamics
At its core, KinderCare operates childcare centers delivering early education services primarily paid for by families but subsidized extensively through federal, state, and local government programs targeting tuition affordability and universal pre-K support [S1],. The company’s revenue mechanics depend significantly on these subsidies which enable access for a wider customer base but concurrently tether revenues to public-sector budgetary decisions.
Families pay tuition fees either directly or through subsidies; KinderCare earns based on enrollment volumes multiplied by prevailing tuition rates after accounting for mix effects related to subsidy eligibility. This creates a sensitive interplay between price adjustments (largely regulated or market-driven), enrollment trends influenced by demographic factors or economic conditions, and government reimbursement levels.
Service quality hinges on curriculum delivery aligned with early childhood education standards plus regulatory compliance at the center level. KinderCare invests in standardizing program offerings while adapting to local regulations—a necessary cost element that simultaneously reinforces brand credibility but pressures margins.
Competitive Environment and Industry Structure in Early Education Services
The early childhood education sector comprises a fragmented but highly regulated landscape where scale confers notable advantages in negotiating government contracts for subsidies and managing compliance burdens. Competitors range from small local providers to large chains; KinderCare is positioned among the larger operators benefiting from widespread geographic coverage.
The complexity of administering childcare programs compliant with varied federal/state/local requirements represents a significant barrier to entry for smaller competitors lacking specialized expertise or capital backing. Moreover, integration into government subsidy networks enhances switching costs for families reliant on subsidized tuition models—a structural moat supporting KinderCare’s market persistence despite competitive pressures.
Nonetheless, the sector is cyclical relative to demographic shifts such as birth rates influencing enrollment plus political changes dictating subsidy availability or scope—introducing volatility risks.
Growth Drivers: Enrollment Trends, Government Subsidies, and Strategic Initiatives
KinderCare’s growth prospects rely heavily on maintaining or growing enrollment across its center network. This depends first on macrodemographic tailwinds including birth rate trajectories impacting child population cohorts entering care age brackets.
Moreover, consistent or expanded government subsidy programs directly stimulate demand accessibility by mitigating out-of-pocket costs for parents. The renewal or expansion of such programs remains crucial; delays or cuts in funding translate swiftly into lower enrollments or strained cash flow.
Under new CEO Wyatt’s direction since late 2025, strategic initiatives targeting operational efficiencies aim to reduce unit costs per child served while elevating educational service quality—factors expected to enhance incremental margins over time [N1]. Enhancements in family engagement through digital platforms also seek to boost retention rates amid intensifying competition.
Risks and Constraints: Funding Dependency, Regulatory Sensitivity, and Financial Health
A defining risk is KinderCare’s dependence on government funding channels that exhibit susceptibility to political shifts such as federal budget impasses or state/local fiscal reprioritizations. Interruptions in subsidy disbursements have material implications for enrollment volumes and revenue realization given many families’ reliance on these supports [S20]
Regulatory environments impose compliance costs related to staffing ratios, facility standards, safety protocols—and any tightening regulations increase operating expenses restricting margin potential.
Financially, persistent operating losses highlight refinancing or capital raising needs. With total debt nearing $927 million versus cash reserves around $133 million at quarter-end April 2026 ([F1]), the company carries substantial leverage.
This elevated net debt exposes KinderCare to refinancing risk especially should credit markets tighten or if operating losses continue eroding cash cushions.
Forward-Looking Indicators: Milestones to Monitor in Execution and Demand Signals
Monitoring enrollment patterns quarter-to-quarter will provide early signals regarding demand sustainability amid shifting demographic or economic conditions. Tracking timely renewal notices or expansions of government subsidy programs offers critical insight into revenue base stability.
Operational metrics like center utilization rates and cost per enrollment unit will indicate management’s success in translating strategic adjustments into margin improvement.
Key executives’ incentive structures introduced in early fiscal year 2026 intend to align management objectives with financial targets such as revenue growth, margin expansion, and ultimately path toward profitability—milestones investors may watch closely for evidence of effective execution under new leadership [S27]
Financial Overview: Liquidity Position and Capital Structure Context
As reaffirmed by Q1-end balance sheet metrics cited above ([F1]), KinderCare operates under significant leverage constraints with total debt at approximately $926 million offset partially by cash reserves near $133 million leading to a net debt figure around $794 million. Performance losses continue weighing on retained earnings thereby limiting internal cash generation capacity at least in the near term. These financial factors compound operational risks stemming from external funding dependencies making cash flow management a critical focus area as management drives the turnaround strategy post-CEO transition.
This analysis is based solely on publicly filed SEC documents dated through May 14, 2026 ([S1]-[S29]) including recent quarterly disclosures ([S2]) complemented by contemporaneous earnings call transcripts ([N1]-[N3]) accompanied by factual financial snapshot data ([F1]) without offering investment advice or research views.
Disclaimer: This is research-only, informational analysis and not investment advice. It may include AI-generated interpretation and general industry context. Always verify important details using primary sources.

Comments