
LPL Financial Expands Scale and Advisory Revenue with Commonwealth Acquisition Amid Market Sensitivity
Strong Q2 2026 revenue growth reflects advisory asset expansion and transaction activity, supported by an integrated brokerage-advisory platform.
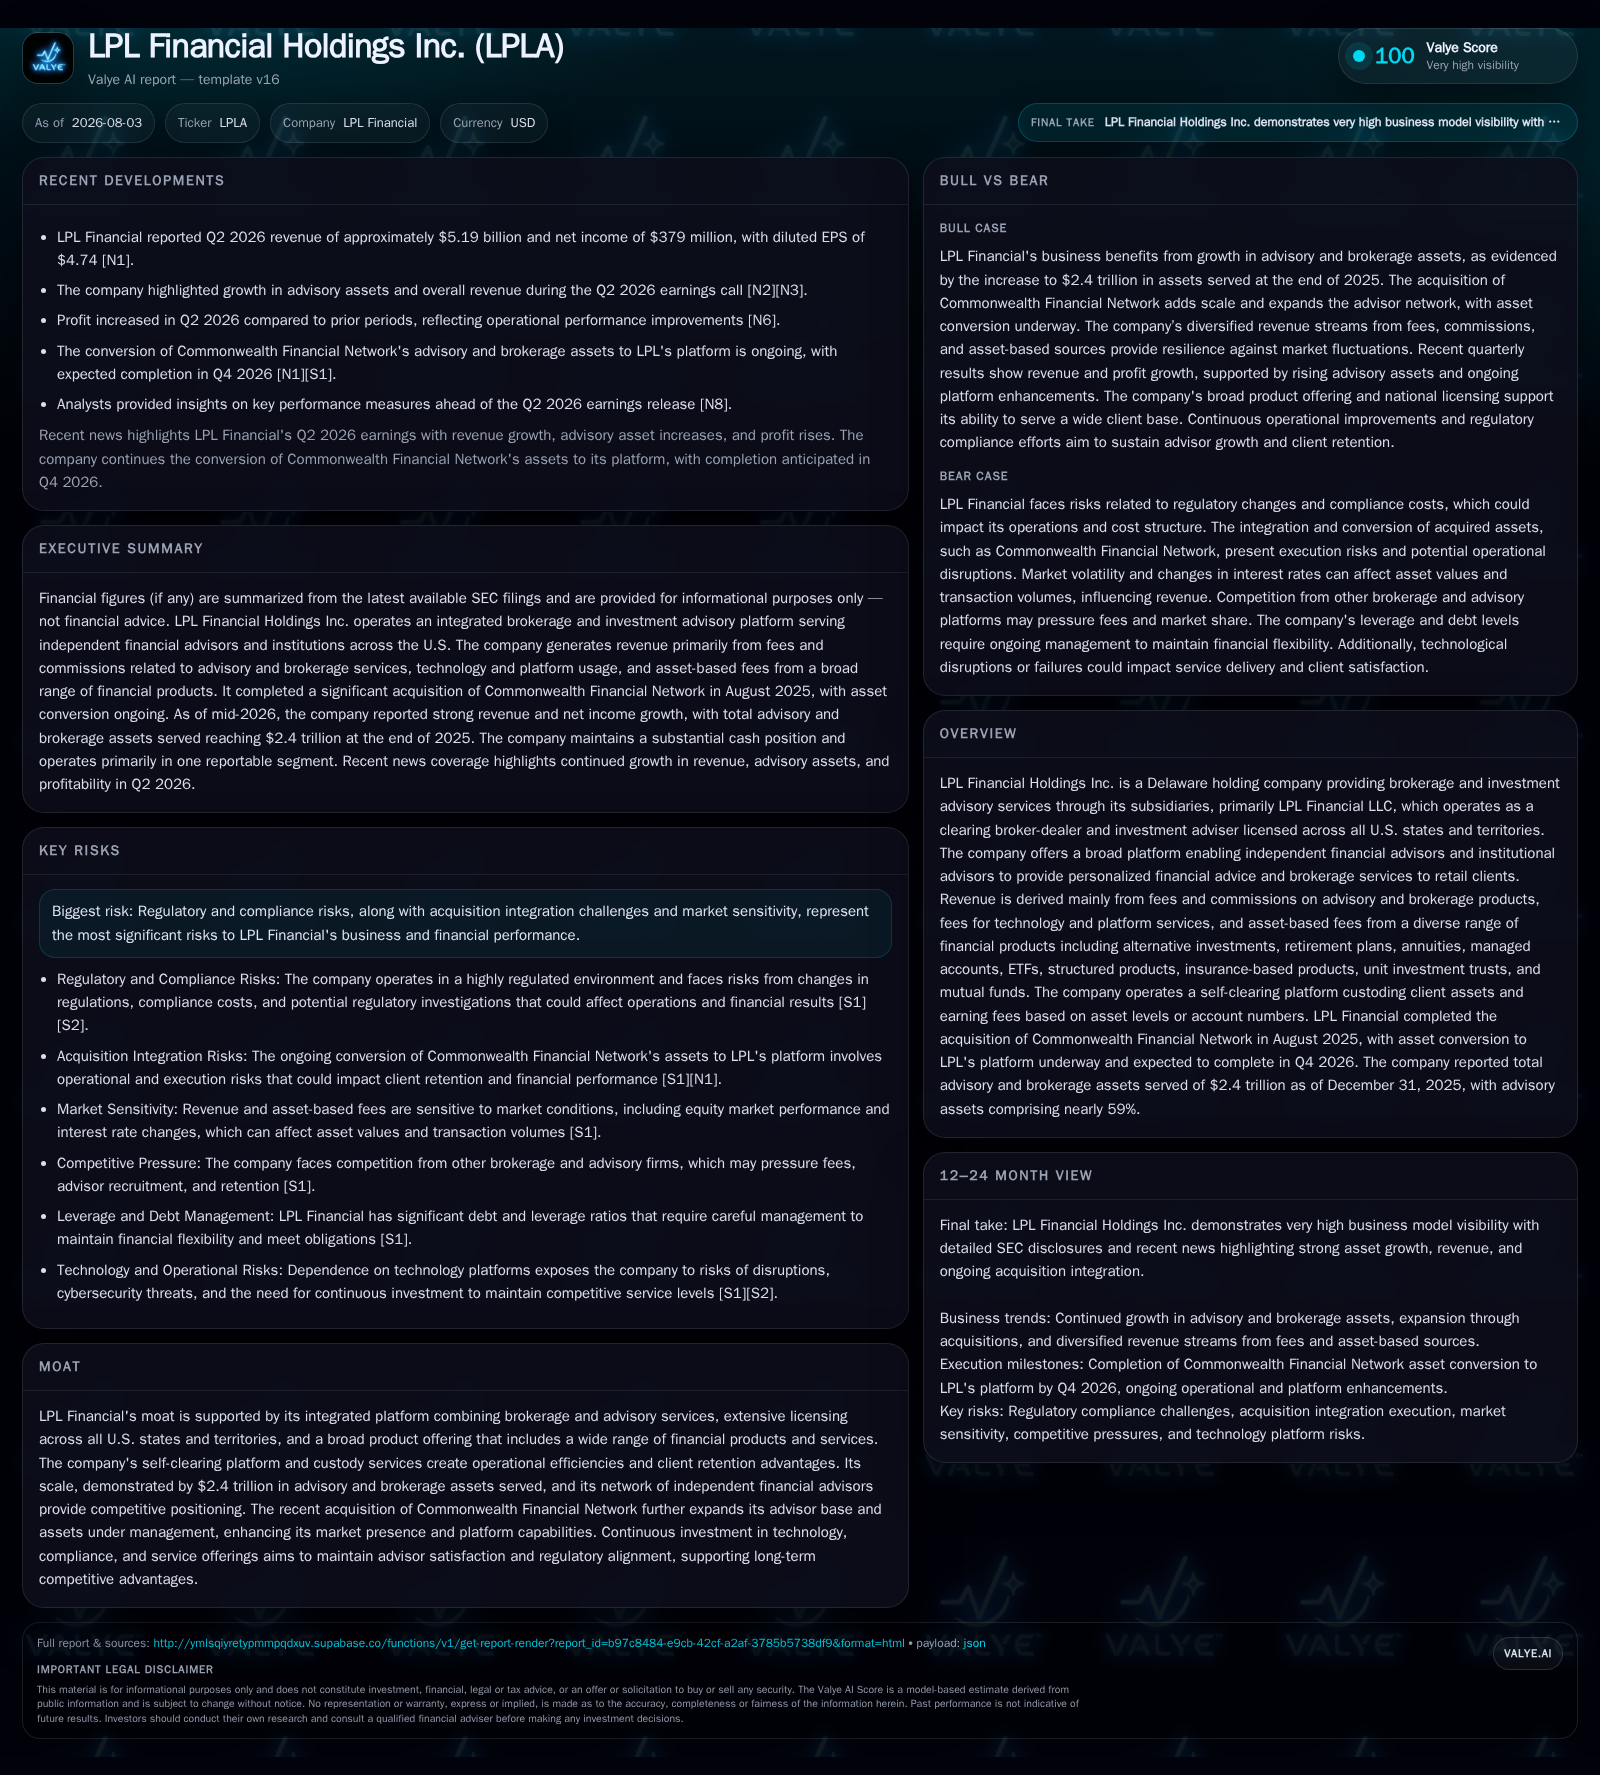
LPL Financial Holdings reported robust second-quarter 2026 results driven primarily by growth in advisory fees and commission revenue, fuelled by the integration of Commonwealth Financial Network. Assets under advisory and brokerage custody expanded to $2.4 trillion, underpinning recurring asset-based fees. The company’s self-clearing platform and broad product suite across alternative investments, managed accounts, annuities, and mutual funds create a durable competitive advantage. However, regulatory compliance complexity, acquisition integration risks, and market sensitivity to asset values remain key challenges. LPL’s balance sheet reflects significant debt raised to fund Commonwealth, with ample liquidity and no covenant concerns as of mid-2026.
Recent Operating Update
The company confirmed progress in integrating Commonwealth into its clearing and custody infrastructure, with the transition of advisory assets expected to finalize in Q4 2026. This sizable acquisition elevated LPL’s advisory and brokerage assets served to approximately $2.4 trillion—an important scale milestone that entrenches its position as one of the largest independent broker-dealers offering an integrated platform across all U.S jurisdictions [S1], [S23].
Business Model Analysis
LPL operates as an intermediary clearing broker-dealer and investment adviser platform targeting independent financial advisors who provide personalized advice to retail clients. It is licensed nationwide across all U.S states and territories allowing broad geographic reach.
The firm’s revenue model is diversified into four interlocking streams: asset-based advisory fees calculated as a percentage of client assets under management (AUM); commissions from brokerage transactions including sales-based upfront commissions and trailing commissions; fees charged for technology platform usage including custody, clearing services, reporting infrastructure; and interest income from margin lending and client cash deposits swept into insured vehicles.
This hybrid monetization approach benefits from both recurring revenue stability tied to AUM (asset-based fees) plus transactional upside captured through commissions during active market conditions or client portfolio rebalancing events. Its self-clearing platform is particularly strategic since it allows direct custody of most client assets—enhancing control over operational processes while delivering comprehensive reporting services that boost advisor satisfaction and retention metrics.
A broad product offering including alternative investments, retirement plans, annuities, separately managed accounts (SMAs), ETFs, structured products, insurance-based solutions, unit investment trusts (UITs), mutual funds further expands cross-selling opportunities while diversifying revenue sources beyond typical equity market dependency.
The recent acquisition of Commonwealth added roughly $600 billion in AUM/advisory assets expanding the advisor network substantially which should generate operating leverage benefits over time once integration costs are absorbed fully in coming quarters [S1], [S23].
Industry Structure & Competitive Positioning
LPL participates within a competitive landscape comprising full-service broker-dealers (e.g., Charles Schwab), independent broker-dealers like Raymond James Financial, registered investment advisers (RIAs), custodial clearing providers along with fintech platforms focused on wealth technology innovation.
LPL’s moat is constructed around its integrated platform combining brokerage transactional capabilities with ongoing fiduciary advisory services—delivered through a self-clearing operational model that tangibly improves cost structure efficiency compared to peers reliant on third-party clearing agents. The extensive licensing footprint (all U.S states) facilitates national advisor recruitment without geographic barriers.
Its diverse product catalog positions it well compared to more specialized firms that may focus heavily on either brokerage or advisory but not both simultaneously. This breadth enhances resilience against regulatory shifts influencing either type of revenue stream independently.
Investment in technology platforms remains critical industry-wide for competitive differentiation; LPL has consistently emphasized these capabilities evidenced by rising technology fee income which correlates with growing adoption across its advisor base—an important KPI closely watched in this sector [S2]
Growth Drivers
Key growth vectors include:
- Advisory Assets Growth: Driven both organically via market appreciation plus net new inflows alongside accretive acquisitions like Commonwealth which add scale and advisor relationships.
- Advisor Recruitment & Retention: Expanding the network of independent advisors increases potential client assets serviced; training and technology support enhance advisor productivity.
- Product Offering Expansion: Increasing penetration into alternative investments, structured products, managed accounts anchors higher-margin asset-based fees relative to plain vanilla equity products.
- Technology Platform Enhancements: Upgrading digital tools improves advisor/client experience fostering deeper wallet share retention.
- Market Conditions: Positive equity markets aid portfolio valuations boosting asset-based fees though downside risks remain if market volatility spikes negatively impacting transaction volume or AUM values.
- Regulatory Tailwinds: Favorability toward fiduciary standard enforcement can increase demand for advisory services over direct brokerage transactions.
Risks & Watchpoints
Principal risks stem from:
- Regulatory Complexity: Compliance demands are intensifying in areas such as anti-money laundering programs prompting ongoing investment in controls; prior SEC investigations highlight exposure points ([S18]).
- Acquisition Integration Risk: Complex migration of Commonwealth’s assets may face operational delays or advisor attrition affecting short-term earnings consistency.
- Market Sensitivity: Asset-based revenues inherently fluctuate with capital markets with potential adverse impact during downturns or prolonged low volatility phases.
- Operational Risk: Failure or disruption within clearing or custody systems could damage reputation or lead to regulatory penalties ([S1]).
- Competitive Pressure: Fintech disruptors offering low-cost platforms could erode advisor win rates or accelerate fee compression in some segments.
What To Watch Next
Analysts should focus on Q4 2026 for status updates on:
- Completion of Commonwealth integration confirming run-rate synergies materialization.
- Continued trends in advisor recruitment/retention metrics reported during earnings calls as indicators of platform desirability.
- Revenue mix evolution reflecting balance between advisory fee stability versus commission-driven transactional gains.
- Regulatory developments influencing product structuring or disclosure requirements potentially impacting fee models.
- Capital allocation actions including share repurchase pacing given recent Board authorization expanding repurchase capacity by another $2.5 billion post-July 2026 execution ([S24]).
Financial Profile Discussion
As of June 30, 2026, LPL held approximately $1.28 billion in cash and equivalents with total debt outstanding near $7.3 billion as of December 31, 2025 ([F1]; no interim figures updated). Net debt approximates $6 billion indicating moderate leverage following the sizable funding required for the Commonwealth acquisition completed mid-2025 ([F1], [S5]).
Interest expense stood near $101 million per quarter reflecting both fixed-rate senior notes issued mainly in April 2025 alongside floating rate term loans refinanced at more favorable spreads ensuring manageable cost despite sizable debt load ([S2], [S5]).
Operating expenses rose commensurately with revenue expansion driven largely by increased payouts related to advisory/commission compensation; promotional spend also increased alongside occupancy costs as office footprint scales post-acquisition ([S2]). Adjusted EBITDA margins must be monitored closely going forward considering cost inflation pressures versus realized operating leverage from asset growth.
The company maintains active share repurchase programs which resumed post-acquisition pause aiming for disciplined capital return aligned with free cash flow generation capacity ([S24], [S17]).
This analysis reflects current SEC filings through Q2 2026 supplemented by recent public earnings commentary focusing solely on supported financials and operating disclosures without speculative forecasts or investment research views.
Disclaimer: This is research-only, informational analysis and not investment advice. It may include AI-generated interpretation and general industry context. Always verify important details using primary sources.

Comments