
Luda Technology Group Faces Revenue Pressures and Operational Challenges in PRC Manufacturing Segment
The company's FY2025 results highlight significant declines in revenue and gross margins, with concentrated exposure in the PRC manufacturing market posing growth and risk considerations.
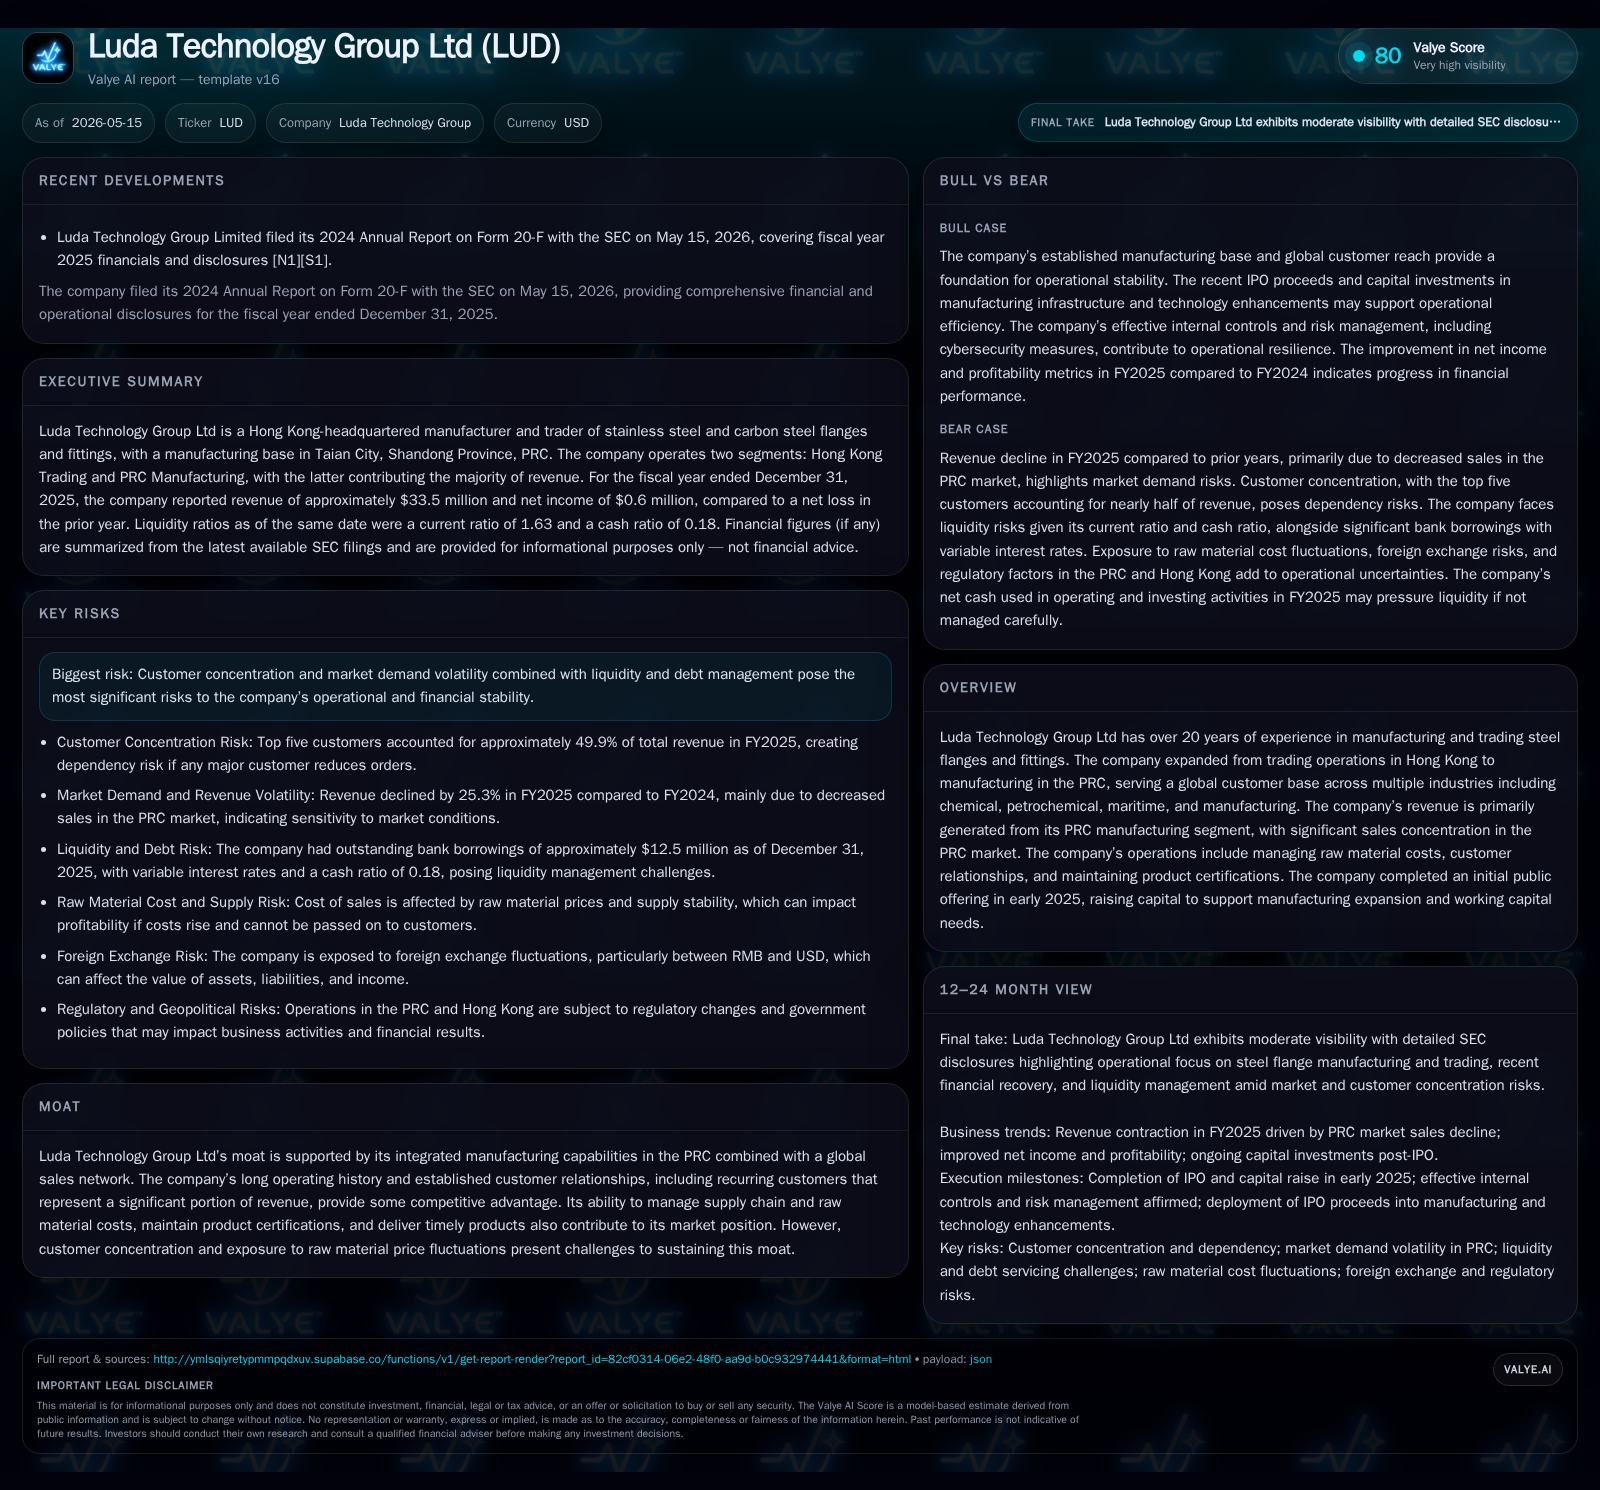
Luda Technology Group Ltd reported a 25% revenue decline in 2025 driven primarily by lower sales in its PRC manufacturing business. Gross profit dropped nearly 50% due to margin compression amid challenging market conditions. While the company returned to net profitability, it faces sales concentration risks and pressure on operating expenses. Strategic focus remains on managing raw material costs, maintaining certifications, and expanding tender wins to stabilize demand.
Recent Operating Update
Luda Technology Group Ltd's latest quarterly filing dated May 15, 2026 [S2] reveals that fiscal year 2025 (FY2025) results were characterized by a significant downturn in revenue and gross profit, largely attributable to weakened sales within the company's core PRC manufacturing segment. Total revenue fell by approximately 25.3% year-over-year to $33.5 million, driven chiefly by a drop in PRC market demand where the company generated roughly 73% of its top line [S1]. This contraction reversed some momentum from prior years where the firm had maintained higher levels of sales.
Gross profit declined disproportionately by nearly half—down about $5.5 million—resulting in a compressed gross margin from 25.4% in FY2024 to just 17.7% in FY2025 [S4]. The margin decline signals pricing pressure amidst lower volumes and potential raw material cost challenges given fluctuations in steel prices highlighted as an ongoing risk [S2]. Operating expenses saw a marked reduction with selling expenses dropping by around $4.5 million; this decrease was mainly due to less spending on sales consulting fees that correlates with fewer bidding activities during the period [S4].
However, despite these headwinds, Luda reported net income of approximately $0.56 million for FY2025 compared with a net loss in the prior year [S4]. This return to profitability was bolstered by other income sources such as unrealized gains from short-term investment holdings and extinguishment of consulting liabilities [S20].
Business Model
Luda Technology Group operates primarily as a manufacturer and trader of stainless steel and carbon steel flanges and fittings products [S1]. The business evolved from trading operations based in Hong Kong (Luda HK) initiated in 2004 into upstream manufacturing with a self-owned factory established in Taian City, Shandong Province, PRC starting in 2005 (Luda PRC). Today the PRC Manufacturing segment accounts for over 70% of total revenues [S1].
Revenue generation hinges on both self-manufactured flange product sales as well as trading activities for related steel pipes, valves, and fittings sourced externally [S1]. The vertically integrated model gives Luda some control over cost inputs such as raw materials and quality through direct manufacturing while leveraging the Hong Kong entity's trading capabilities abroad.
Customers primarily operate within capital-intensive sectors: chemical processing, petrochemical refining, maritime shipbuilding/repair, and general manufacturing [S1]. Given these verticals’ project nature—often driven by capital expenditures or infrastructure upgrades—revenue tends toward lumpier cycles tied closely to industrial investment spending.
Margins vary based on product mix (manufactured goods vs trading), scale efficiencies at the Taian facility, supply chain management especially amid steel price volatility, and bidding success rates for large contracts requiring specific product certifications [S1], [S2]. Maintaining licenses and certifications is critical for customer retention and new order acquisition.
Industry Structure and Competitive Position
The niche of steel flanges and fittings is competitive but defensible through manufacturing scale coupled with quality certifications tailored for demanding industries such as petrochemical refining. Luda’s two-decades operational history lends it embedded client relationships which account for recurring revenue streams.
Its moat rests on integrated downstream manufacturing combined with global sales reach through Hong Kong trading operations. However, geographic concentration—primarily reliance on PRC customers (over two-thirds of revenue)—exposes it heavily to regional regulatory shifts including VAT refund policy changes noted as a challenge recently [S2]. Furthermore, exposure to raw material price swings impacts cost predictability.
Competitors include regional manufacturers with potentially greater scale or diversified geographic exposure plus international suppliers meeting certification standards required by industrial clients.
Growth Drivers
Key drivers include:
- Order Intake from Large Projects: Winning tenders such as the recent China Yulong Island Refining Project tender (Phase One) secured in April 2026 demonstrates capacity to capture sizable contracts essential for ramping volume [S3].
- Expansion of Manufacturing Capacity: IPO proceeds raised early 2025 have been partially deployed toward facility expansion and machinery upgrades aimed at improving throughput and product quality consistency.
- Certification Renewals: Maintaining industry certifications underpins contract eligibility especially in petrochemical sectors.
- Supply Chain Efficiency: Cost reductions via improved procurement strategies for raw steel could alleviate margin pressure amidst volatile commodity pricing.
- Diversification of Customer Base: Growth outside PRC markets—currently contributing about one-third of total sales including South America and Asia ex-China regions—could reduce concentration risk.
- New Product Development: Stable R&D expenditure (~$1.45 million annually) supports incremental innovation or customization that can differentiate offering [S19], [S16].
Risks and Watchpoints
- Revenue Concentration Risk: Heavy dependence on PRC industrial demand makes the company vulnerable to regional economic slowdowns or policy changes affecting infrastructure or capital projects sector-wide.
- Volatility in Raw Material Costs: Fluctuations in steel prices can squeeze margins if pricing power is limited or unable to be passed along promptly.
- Liquidity Constraints: While carrying sufficient cash (
$4.5 million) against relatively modest debt ($1.8 million), operating cash flow weakened considerably (-$1.7 million net cash used from operations FY2025) raises concerns about ongoing working capital sufficiency without further financing [F1], [S21]. - Competition Pressure: Larger players' economies of scale or more diversified customer portfolios may erode market share.
- Dependence on Certifications & Licensing: Any lapses could restrict eligible contracts or delay project execution timelines.
- Market Demand Cyclicality: Industrial sectors served are subject to cyclical investment patterns making sustained growth inherently choppy.
What To Watch Next
Investors should track several catalysts:
- Announcement of subsequent major project awards similar to China Yulong success will signal improving customer traction.
- Quarterly revenue trends from PRC manufacturing segment will confirm if decline has stabilized or continues downward trajectory.
- Updates regarding renewal status of critical production licenses/certifications impacting market access.
- Steel raw material cost trends versus average selling price changes indicating margin recovery prospects.
- Management commentary on operational adjustments aimed at improving cash flow conversion given negative operating cash outflows reported FY2025.
- Potential disclosures about expansion plans post-IPO capital deployment effectiveness.
Financial Profile Summary
Latest financial snapshot
| Metric | Value | Period |
|---|---|---|
| Cash & equivalents | $5mm | |
| 2025-12-31 | ||
| Total debt | $1773176 | |
| 2025-12-31 | ||
| Net debt | $-3mm | |
| 2025-12-31 | ||
| Current assets | $40mm | |
| 2025-12-31 | ||
| Current liabilities | $25mm | |
| 2025-12-31 | ||
| Current ratio | 1.63x | |
| 2025-12-31 |
Source: SEC companyfacts cache [F1].
The balance sheet at year-end displays moderate leverage levels — approximately $1.8 million total debt versus nearly $4.5 million cash equivalents — yielding an estimated net cash position aided also by solid current assets near $40 million against current liabilities around $24.5 million (current ratio ~1.63) suggesting decent liquidity runway although operational cash burn flagged as a watchpoint needs addressing via either improved working capital management or financing options going forward [F1], [S7], [S15]. Capital expenditures remain modest under half a million annually demonstrating conservative fixed asset additions consistent with steady state plant operations rather than rapid scaling currently seen elsewhere amid orders softness [S16].
This analysis is based purely upon currently available filings dated May 15, 2026, without incorporation of external information beyond cited SEC disclosures and company data snapshots provided herein. No investment advice or recommendations are offered or implied.
Disclaimer: This is research-only, informational analysis and not investment advice. It may include AI-generated interpretation and general industry context. Always verify important details using primary sources.

Comments