
LSB Industries Faces Raw Material Volatility and Regulatory Challenges in Q1 2026
The latest quarter highlights operational resilience amid commodity price swings and regulatory scrutiny.
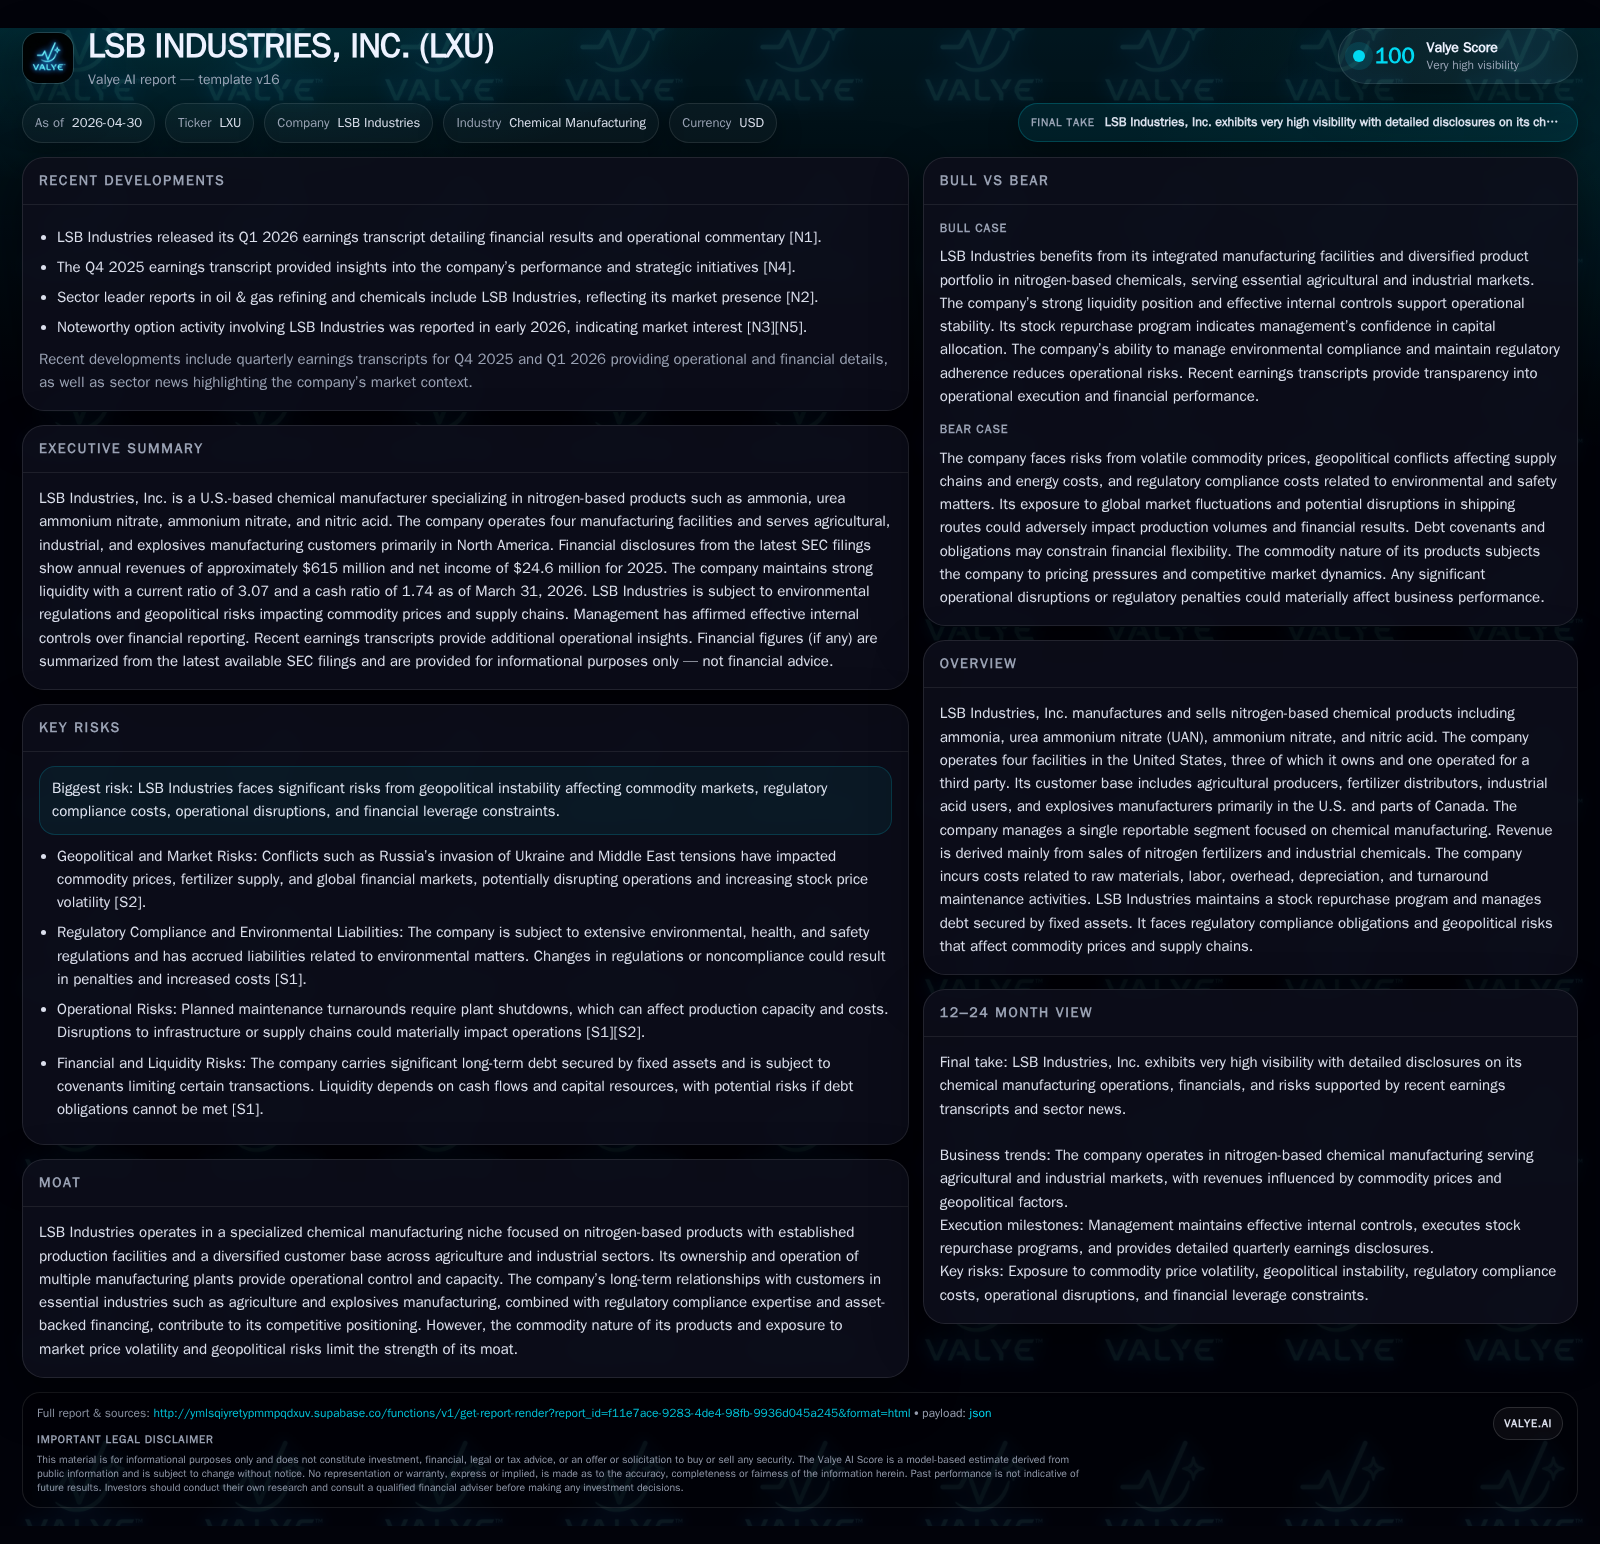
LSB Industries’ Q1 2026 filing underscores ongoing exposure to natural gas price volatility, regulatory compliance costs, and geopolitical risks affecting its nitrogen-based chemical production. The company’s business model centers on manufacturing essential nitrogen fertilizers and industrial chemicals through four U.S. facilities, serving agricultural and industrial customers primarily in North America. While ownership of multiple plants and established customer relationships provide competitive footing, the commodity nature of products and capital-intensive operations constrain margin stability and growth levers. Going forward, management's ability to navigate raw material cost fluctuations, environmental regulations, and demand cyclicality will be critical. The company maintains significant debt secured by assets with a strong liquidity position as of quarter-end.
Recent Operating Update
LSB Industries' latest quarterly filing dated April 30, 2026 [S2] reaffirms the company’s vulnerability to natural gas market volatility — their key raw material input — which continues to heavily influence production costs and gross margins. The report references ongoing geopolitical unrest such as Russia’s war in Ukraine and Middle East tensions exacerbating global energy market uncertainty and fertilizer supply disruptions [S2]. Geopolitical factors have historically led to abrupt raw material price swings affecting both inventory valuations and sales pricing agility.
Additionally, the company disclosed it received a Notice of Violation (NOV) from the Arkansas Department of Environmental Quality concerning wastewater discharges at its El Dorado facility [S1]. This spotlights continuing regulatory challenges demanding capex or process changes that may raise operating expenses or temporarily affect output.
Despite these pressures, LSB reported no material changes in legal proceedings or significant tax position adjustments during the quarter [S2]. Management also updated stakeholders via an earnings presentation on April 30, indicating a cautiously optimistic stance hinged on navigating raw material prices while preserving operational reliability [S3][N1].
Business Model
LSB Industries centers its revenue generation on manufacturing nitrogen-based chemical products such as ammonia, urea ammonium nitrate (UAN), ammonium nitrate, and nitric acid [S1]. These products serve essential sectors: agriculture (fertilizers boosting crop yields), industrial acid users (various chemical processes), and explosives manufacturers (mining and construction applications).
The company operates a single reportable segment focused on chemical manufacturing delivered through four main facilities located within the United States—three owned directly and one operated for a third party [S1]. This ownership structure provides control over production capacity but also concentrates operational risk geographically.
Revenue derives mainly from selling these commodities to fertilizer distributors who further channel products to agricultural producers across North America [S1]. Pricing power is limited due to commodity characteristics; however, contracts sometimes include natural gas cost pass-through clauses mitigating some input cost risk. Nevertheless, sales without such clauses expose LSB to margin compression when natural gas prices spike unexpectedly [S1].
Costs include raw materials (chiefly natural gas), labor, overheads tied to sustaining complex chemical plants, depreciation reflecting capital-intensive asset bases, as well as periodic turnaround maintenance scheduled every few years essential for safety compliance and uninterrupted operations [S1][S26].
Importantly, LSB utilizes futures contracts strategically to hedge portions of natural gas usage but acknowledges incomplete coverage leaves them partially exposed to market swings [S1][S24]. Liability insurance covers many contingencies but carries coverage limits given hazardous materials stored onsite (ammonia) requiring strict health & safety governance [S13][S15].
A notable aspect of capital deployment is an active $150 million stock repurchase plan authorized by the Board in May 2023 [S9], though only modest shares were bought back thus far amid volatile market conditions.
Industry Structure and Competitive Position
LSB holds a niche position specializing exclusively in nitrogen-based chemicals—a subset within the larger diversified chemical manufacturing sector. Operating four mid-sized plants provides respectable scale yet does not cross into integrated fertilizer producing giants that combine potash or phosphate fertilization solutions.
Competitiveness hinges largely on operational efficiency amid fluctuating ingredient costs (notably natural gas) coupled with maintaining consistent output despite stringent environmental permit requirements [S13]. Regulatory complexity is particularly pronounced; failure to maintain permits can severely disrupt production.
The company’s U.S.-centric footprint offers logistical proximity advantages to core customers but limits exposure to emerging international markets where fertilizer demand growth may be faster. However, geopolitical instability abroad indirectly affects LSB through commodity pricing channels since nitrogen fertilizer trading prices are globally influenced.
Customer relationships are anchored on established ties with distributors supplying large agricultural regions. This ecosystem creates some switching costs given volume contracts but does not insulate fully from competitor pricing pressures or alternative suppliers incentivizing end users through differentiated formulations or service models.
Growth Drivers
Growth fundamentally aligns with agricultural sector fundamentals—crop acreage planted and fertilizer application rates set a structural demand base. Periodic weather patterns influencing planting activity or macroeconomic cycles impact volumes more cyclically than structurally.
Advances in fertilizer blends incorporating nitrates support incremental product development routes though LSB is principally traditional in output mix. Industrial growth requiring nitric acid for chemical intermediates presents moderate opportunities beyond agriculture.
Operational uptime gains via maintenance efficiencies or delayed turnaround schedules could enhance volumes sold without material CapEx increases. Furthermore, incremental expansions at existing sites or bolt-on acquisitions could augment capacity if justified by market outlook improvements.
Pricing environment improvements tied to balanced supply-demand states energize margins but remain susceptible to sudden shocks from energy markets or geopolitical escalations disrupting input availability or shipping routes [S2].
Management’s focus on disciplined hedging strategies for key inputs combined with selective capital expenditures aiming at improving environmental compliance efficiencies also aims at safeguarding cash flow stability underpinning future growth investments.
Risks / Watchpoints / Growth Constraints
Regulatory risk is persistent including potential permit nonrenewals or newly imposed restrictions increasing operating costs materially; the recent NOV exemplifies this exposure [S1][S22]. Environmental remediation liabilities though currently accrued conservatively could escalate if regulations tighten further or incidents occur [S25].
Raw material supply disruptions originating from natural gas shortages—or expensive price environments undermining ability to recover costs fully—continually threaten margin integrity. Given some contracts lack pass-through provisions entirely this risk is asymmetric.
Market demand risks stem from agricultural sector cyclicality: downturns driven by reduced farm incomes or shifts in crop planting patterns can depress volumes sold over multiple quarters impacting revenues materially. Also trade policies/tariffs restricting fertilizer imports/exports add uncertainty layers.
Operational risks include plant outages—either planned turnarounds or unplanned downtimes due to equipment failures—that disrupt deliveries potentially risking customer relationships. Capacity expansion prospects remain limited absent major capital deployment which may be hampered by financing conditions under existing covenant structures.
What To Watch Next
Key milestones include updates on regulatory compliance statuses especially pertaining to ongoing environmental investigations or permit renewals at core facilities [S2][S22]. Quarterly reports evidencing management success in passing through higher input costs amid volatile natural gas prices will signal margin trajectory sustainability.[N1]
Backlog levels or forward sales commitments indicated in subsequent filings will provide clarity on demand momentum post-plant turnaround phases. Monitoring debt refinancing efforts or adjustments to leverage ratios within covenant thresholds will shed light on financial flexibility preservation plans.[F1]
Any announcements regarding strategic acquisitions targeting capacity growth or product diversification merit close attention given potential impact on future scale or margin profiles.[S16]
Finally, guided outlook commentary offered during earnings calls will help contextualize management’s assumptions around geopolitical risk implications given recent turbulence noted in Q1 discussions.[N1]
Financial Profile Summary (Latest Snapshot)
Latest financial snapshot
| Metric | Value | Period |
|---|---|---|
| Cash & equivalents | $21mm | |
| 2026-03-31 | ||
| Total debt | $440mm | |
| 2026-03-31 | ||
| Net debt | $420mm | |
| 2026-03-31 | ||
| Current assets | $321mm | |
| 2026-03-31 | ||
| Current liabilities | $105mm | |
| 2026-03-31 | ||
| Current ratio | 3.07x | |
| 2026-03-31 |
Source: SEC companyfacts cache [F1].
| Metric | Value | Period End |
|---|---|---|
| Cash & Equivalents | $20.64 million | |
| 2026-03-31 | ||
| Total Debt | $440.43 million | |
| 2026-03-31 | ||
| Net Debt | ~$419.79 million | |
| 2026-03-31 | ||
| Current Assets | $321.30 million | |
| 2026-03-31 | ||
| Current Liabilities | $104.56 million | |
| 2026-03-31 | ||
| Current Ratio | 3.07 | |
| 2026-03-31 | ||
| [F1] |
These figures reflect a balance sheet with ample short-term liquidity relative to immediate liabilities while carrying substantial long-term secured debt primarily attributable to Senior Secured Notes maturing in 2028 [S4][S7].
This analysis has been prepared based exclusively on publicly available information including SEC filings dated through April 30, 2026 and should not be construed as investment advice or a recommendation concerning LSB Industries securities.
Disclaimer: This is research-only, informational analysis and not investment advice. It may include AI-generated interpretation and general industry context. Always verify important details using primary sources.
Comments