
Corning's Strategic Segment Realignment and Optical Communications Growth Drive Near-Term Trajectory
Corning’s Q1 2026 update highlights structural shifts in segment reporting and sustained strength in optical communications amid supply and demand challenges.
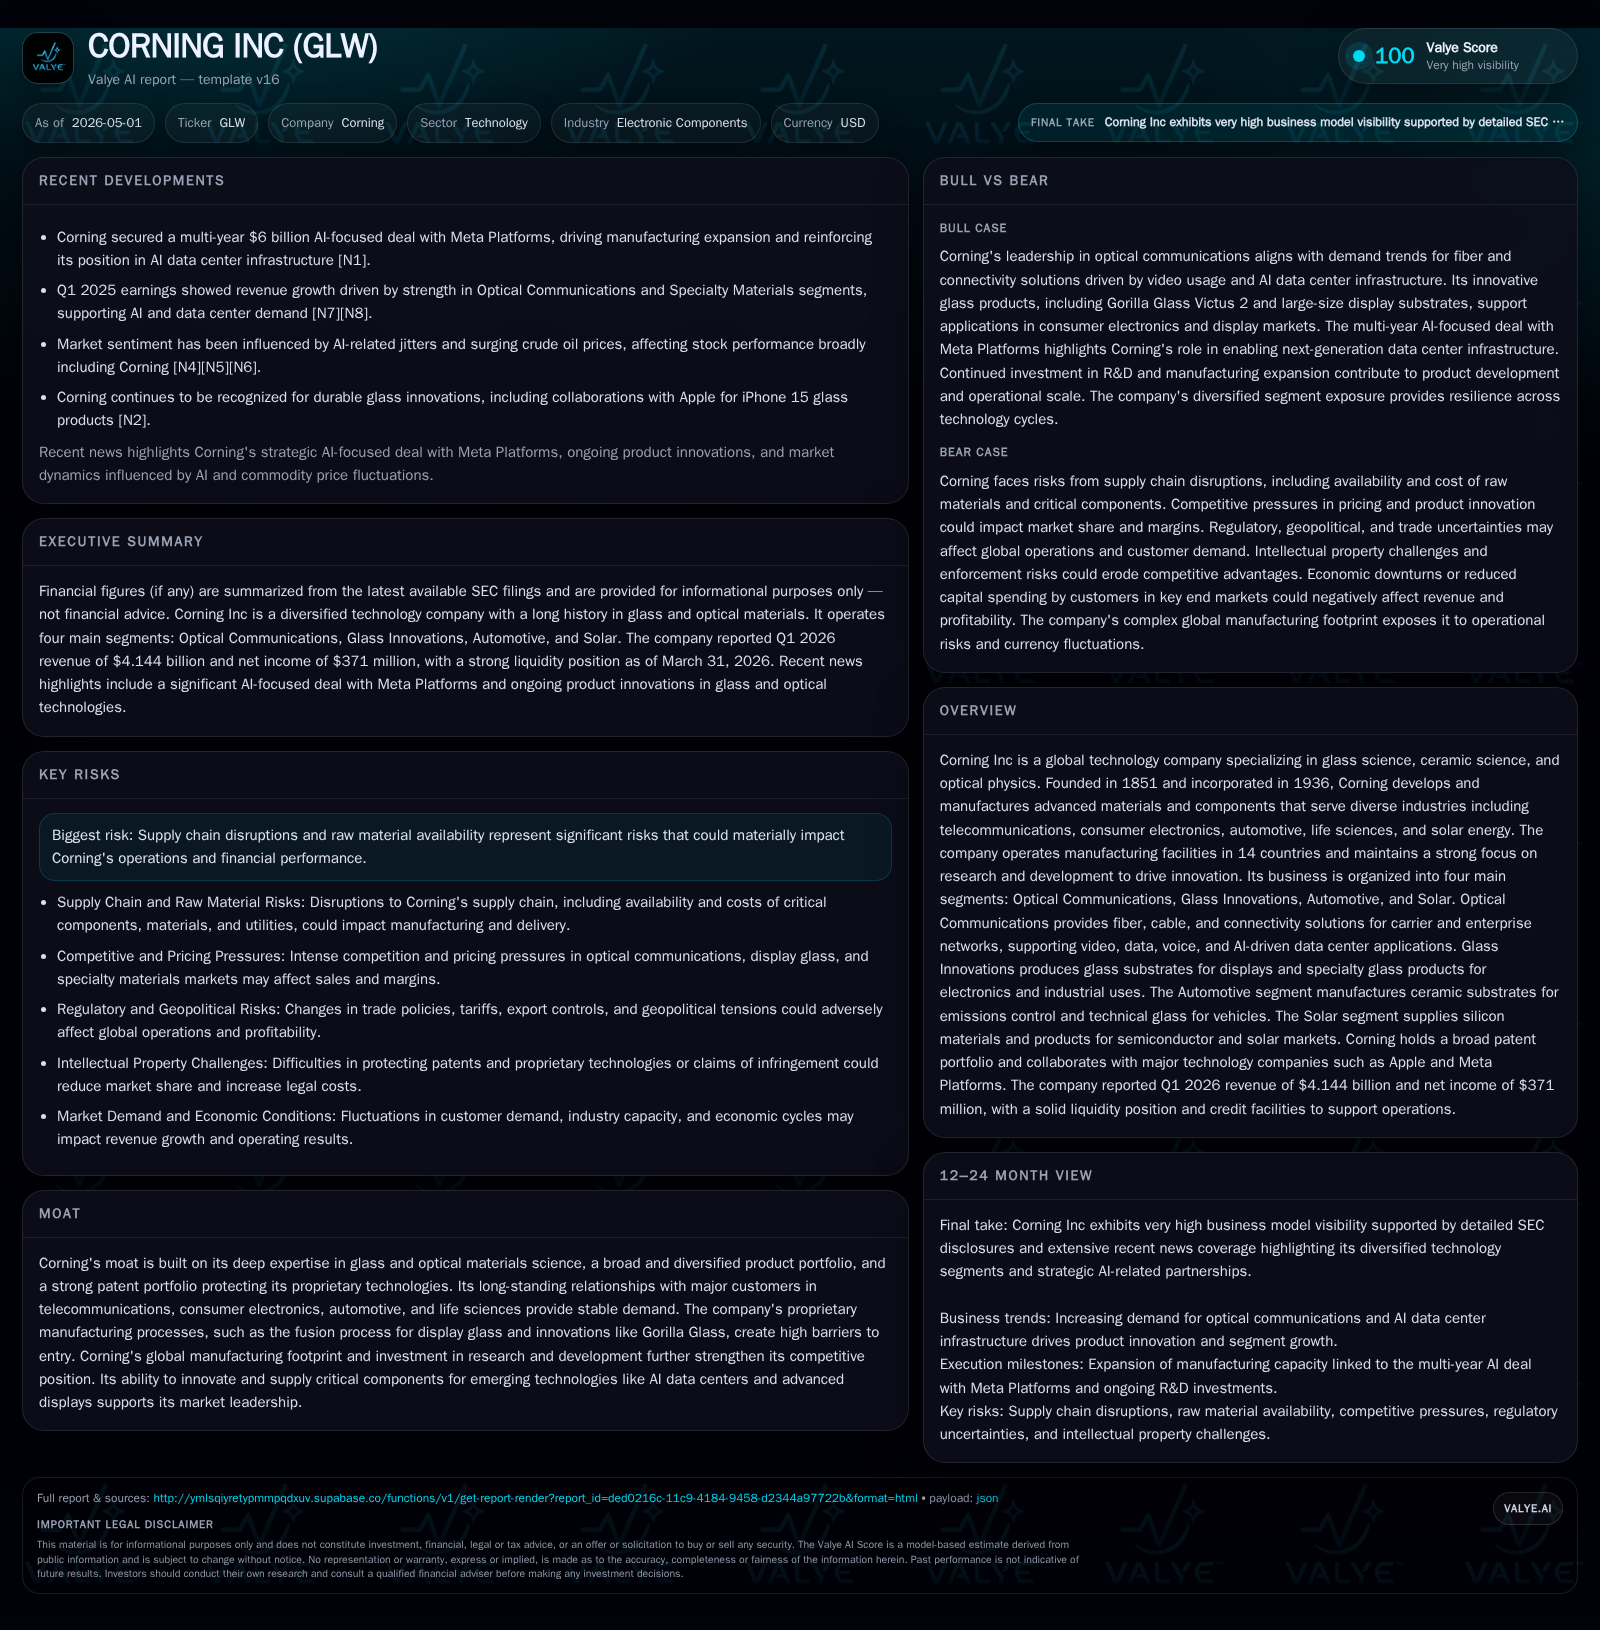
In its latest quarter, Corning Incorporated implemented a significant segment realignment consolidating Glass Innovations and Solar businesses, reflecting evolving management priorities. The company reported continued robust demand in its Optical Communications segment, driven by AI data center expansion and video traffic growth, offsetting softness in Display and Automotive segments. Supply chain constraints and raw material cost pressures remain risks to execution. Corning’s entrenched glass science expertise and diversified portfolio underpin its competitive moat amid shifting industry dynamics.
Recent Operating Update
Corning Incorporated's first quarter 2026 filing (10-Q dated May 1) details notable changes in business structure alongside ongoing operational performance [S2]. The company redefined its segmentation to better align with internal management review: Glass Innovations now merges traditional Display Technologies with Specialty Materials; Solar consolidates Hemlock Semiconductor's polysilicon production with solar wafer/module operations; Automotive combines Environmental Technologies with Automotive Glass Solutions; Life Sciences has been folded into Emerging Growth Businesses due to sub-threshold scale [S3][S8][S9]. These shifts reflect a broader strategic move to unify related technologies under coherent reporting units more reflective of customer end-markets and capital allocation decisions.
Operationally, Corning continues to see strong demand in its Optical Communications segment, supported by exponential growth in video content consumption and especially the surge in AI-driven data center deployments requiring fiber optic upgrades [S1][S3]. This segment's strength offsets softening conditions seen in Display glass—impacted by cyclical pressures—and Automotive glass products where market demand is variable [S1][N4]. Notably, supply chain delays and the elevated costs of raw materials remain key challenges threatening timely fulfillment and margin stability [S16].
Business Model
Corning generates revenue primarily through sales of advanced glass- and ceramic-based components serving diverse end markets: telecommunications networks (fiber optics), consumer electronics (mobile cover glass), automotive (ceramic substrates for emissions control, glass optics), semiconductor materials (polysilicon), solar energy components (solar wafers/modules), life sciences labware, and emerging technologies. Customers pay for products often on negotiated contracts or purchase orders driven by volume commitments tied to network buildouts or manufacturing volumes [S1]. Revenue is influenced by volume growth (e.g., fiber kilometers sold), pricing per unit (subject to input cost pass-throughs), product mix shifts towards higher-value specialty materials or innovative coatings, usage patterns within high-volume hyperscale data centers or automotive OEMs, as well as contract renewals.
Margins fluctuate based on input cost inflation (notably rare earths, lithium derivatives used in ceramics/polysilicon), capacity utilization rates in manufacturing plants, efficiency gains from proprietary processes like fusion draw for display glass or Gorilla Glass technology for mobile devices, and sales mix between commodity optical fibers versus premium specialty materials [S11].
Industry Structure and Competitive Position
The electronic components industry is fragmented but intensely competitive with specialized players in fiber optics (like Prysmian or Furukawa Electric), display glass (e.g., Asahi Glass/AGC), automotive ceramics suppliers (NGK Insulators), semiconductor materials (Hemlock being partly owned by Corning historically though fully integrated now within Solar segment), and life sciences consumables (Thermo Fisher among others). Corning’s moat stems from deep expertise in glass science developed over nearly two centuries paired with intellectual property protecting signature products such as Gorilla Glass—a standard for device manufacturers worldwide. Its global manufacturing footprint spanning 14 countries enables diversified supply chains less vulnerable to regional disruptions.
Furthermore, Corning’s longstanding relationships with tier-one telecom operators embedded within massive infrastructure projects provide predictable bulk orders enabling economies of scale. Proprietary manufacturing methods such as their fusion process for ultra-thin display substrates create high technical hurdles for new entrants. Their focus on R&D fosters continuous innovation which secures new product pipelines addressing nascent AI data center needs or emerging vehicle interior optic solutions.
Growth Drivers
AI Data Centers & Optical Communications: With AI compute workloads soaring globally, hyperscale data centers require vast fiber deployments internally (data fabric) and externally (network edge). Corning’s fiber cables, connectors, and modules benefit directly from this paradigm shift which appears structural rather than cyclical [S1][N4].
Display & Specialty Materials Innovation: Continued adoption of OLED displays coupled with new form factors demands advanced substrates supplied through Glass Innovations. Specialized glass-ceramics for aerospace defense applications add incremental growth opportunities.
Automotive Electrification & Emissions Controls: Transitioning to electrified vehicles increases need for advanced ceramics for battery modules alongside technical glass employed inside EV cabins representing a mid-term growth runway despite near-term volatility.
Solar Energy Sector Expansion: Integrated polysilicon-to-modules operations via Solar segment position Corning favorably amid global renewable energy policy support although subject to commodity pricing cycles.
Emerging Life Sciences Demand: Though currently below separate reporting threshold, investments in bioprocessing consumables may emerge as a growth lever aligning with biotech sector trends.
Risks / Watchpoints / Growth Constraints
Raw Material Availability: Dependence on scarce precious metals and specialized chemicals poses supply risk exacerbated by geopolitical volatility or export restrictions [S1][S18].
Supply Chain Disruptions: Delays or capacity limitations among suppliers could constrain responsiveness especially during sudden volume surges.
Cyclicality in Display & Automotive Markets: These segments remain sensitive to end-market capital spend fluctuations impacting near-term volumes.
Pricing Pressures: While innovation supports pricing power, increased input costs may limit the ability to pass price rises fully onto customers without volume losses.
Competitive Intensity: Larger rivals with broader product offerings could erode market share if they achieve scale advantages or technological breakthroughs.
Execution on New Segment Strategy: The newly aligned structure demands effective internal coordination; missteps could affect resource allocation efficiency.
What To Watch Next
Key milestones will include quarterly updates on revenue contributions from realigned segments post full-year financial disclosures scheduled later in 2026 [S9]. Monitoring backlog levels or order intake trends within Optical Communications will be critical given AI infrastructure importance [N4]. Progress against supply chain normalization efforts alongside margin trajectories signal execution quality amidst inflationary pressures [S2]. Additionally, capital expenditure announcements relating to capacity expansions or R&D projects underpinning future innovations merit attention. Guidance revisions explicitly stated by management in forthcoming earnings calls will provide directional clarity on how cyclical headwinds balance against structural demand drivers.
Financial Profile Brief Context
Latest financial snapshot
| Metric | Value | Period |
|---|---|---|
| Cash & equivalents | $1755mm | |
| 2026-03-31 | ||
| Total debt | $7.7bn | |
| 2026-03-31 | ||
| Net debt | $6.0bn | |
| 2026-03-31 | ||
| Current assets | $9.5bn | |
| 2026-03-31 | ||
| Current liabilities | $5.9bn | |
| 2026-03-31 | ||
| Current ratio | 1.61x | |
| 2026-03-31 |
Source: SEC companyfacts cache [F1].
As of March 31, 2026, Corning reported cash & equivalents of approximately $1.76 billion against total debt near $7.7 billion resulting in net debt around $6.0 billion; current assets exceed current liabilities yielding a healthy current ratio of 1.61 pointing to short-term solvency strength [F1]. The company’s trailing twelve-month revenue stood at around $15.6 billion with operating income at approximately $2.28 billion according to annualized figures through end-2025 [F1], underscoring sizeable scale underpinning research-driven growth investments.
This analysis is based solely on publicly available information including recent SEC filings dated through May 2026 as well as corroborative news reports up to that date. It does not constitute investment advice.
Disclaimer: This is research-only, informational analysis and not investment advice. It may include AI-generated interpretation and general industry context. Always verify important details using primary sources.
Comments