
Bank of New York Mellon’s Q1 2026 Earnings Reflect Strong Fee Income amidst Rising Costs
BNY Mellon’s Q1 2026 results highlight solid fee-based revenue growth despite margin pressure from elevated operating expenses.
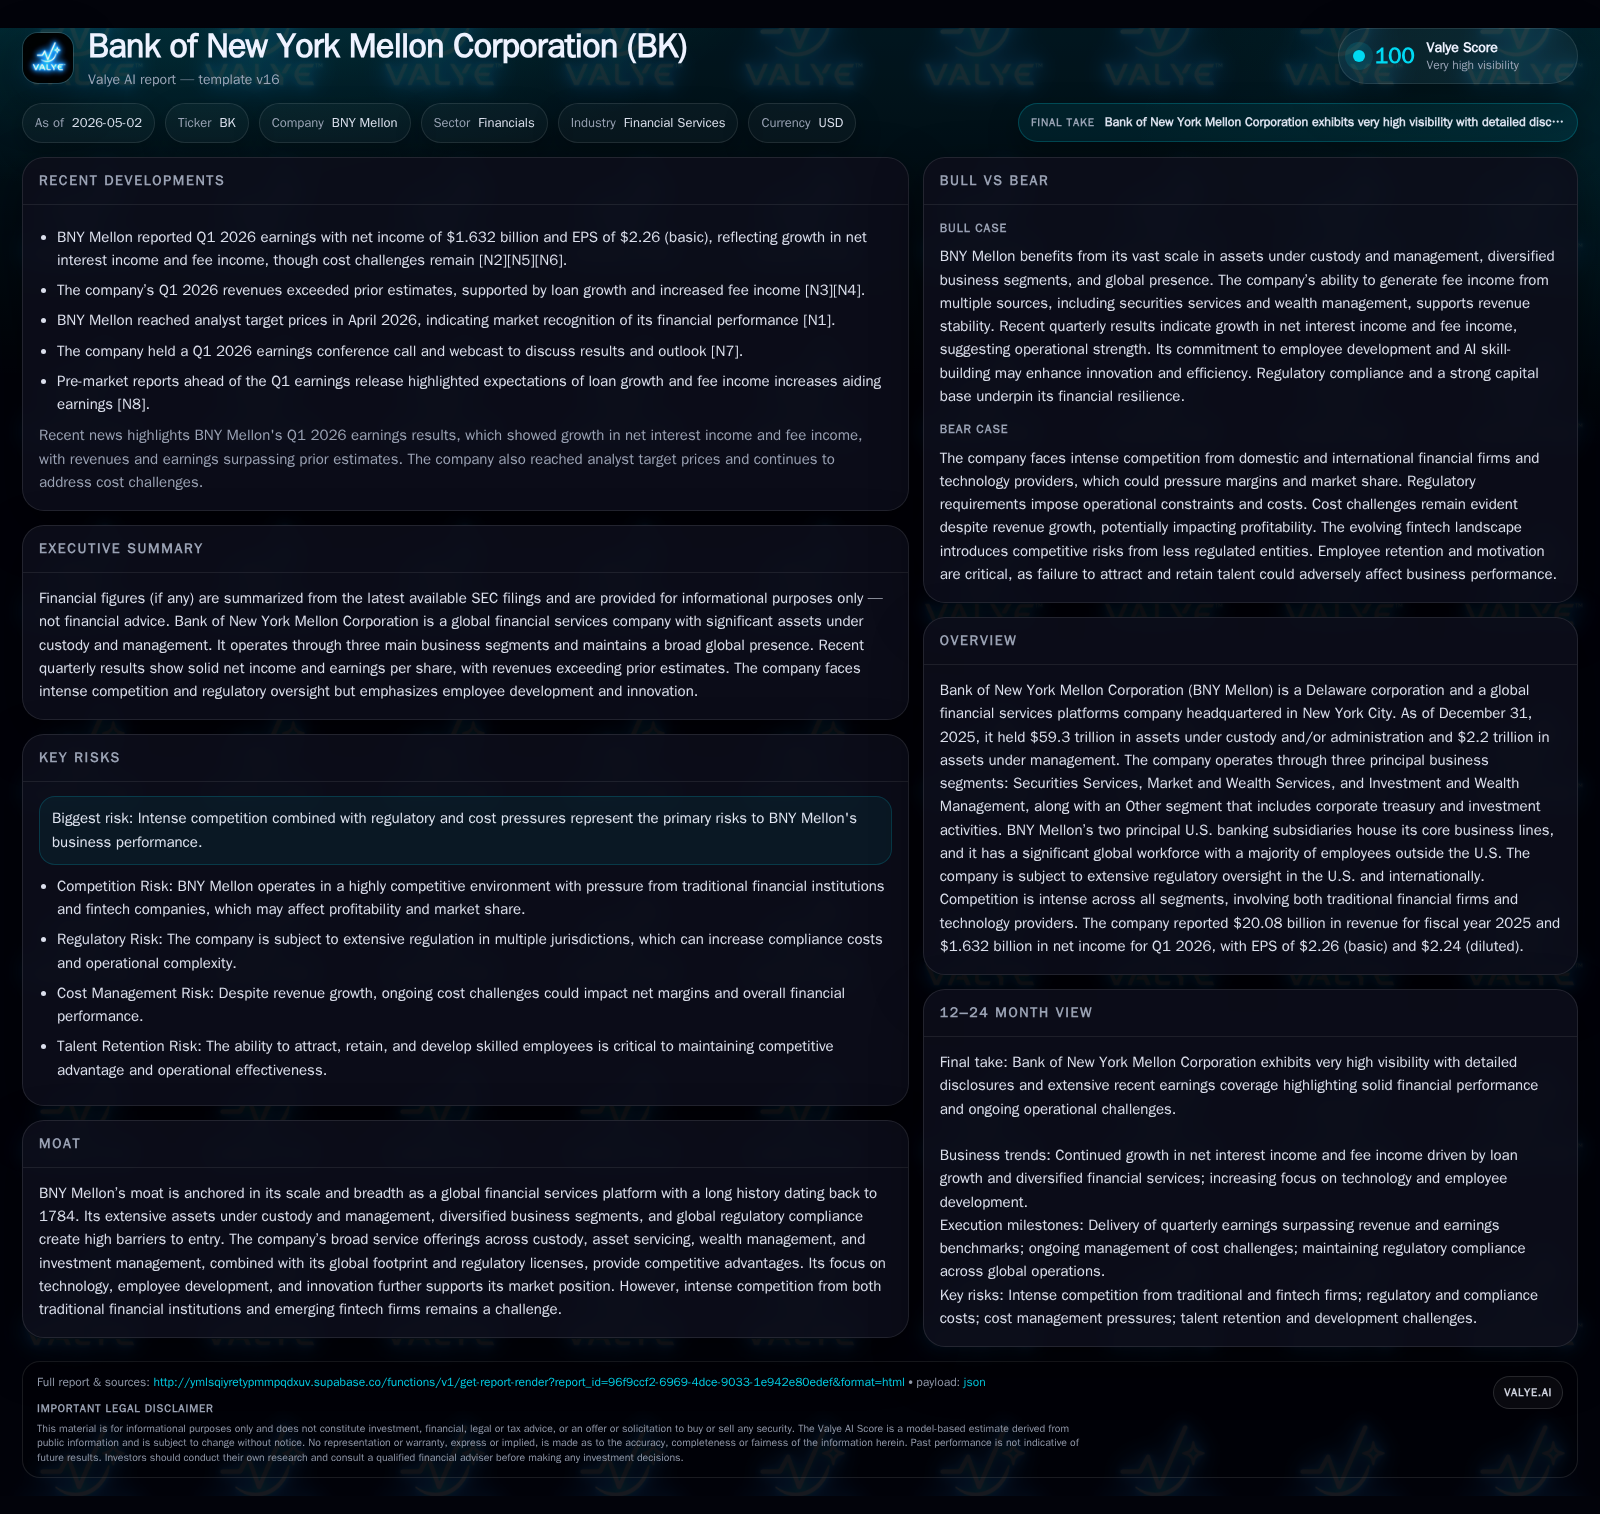
In Q1 2026, Bank of New York Mellon (BNY Mellon) reported continued expansion in fee income driven by its Securities Services and Market & Wealth segments, underscoring robust demand for asset servicing and wealth advisory. However, rising costs and wage inflation compressed operating margins, presenting near-term profitability headwinds. The firm's diversified business model rooted in massive assets under custody ($59.3 trillion) and management ($2.2 trillion) supports resilience in a competitive, heavily regulated market. Going forward, digital innovation and global expansion remain critical growth levers amid intensifying fintech disruption and regulatory complexity.
Q1 2026 Operating Update and Strategic Highlights
Bank of New York Mellon’s Q1 2026 filing dated May 1 reveals solid operating momentum characterized by rising fee income which offset increasing expenses [S2]. Fee-based revenues grew notably in the Securities Services segment attributed to higher volume of assets under custody and expanded collateral management activities. Market & Wealth Services also contributed robustly through increased advisory fees linked to higher assets under administration.
Simultaneously, net interest income (NII) saw an uptick supported by an expanding loan portfolio, reflecting a modestly more favorable interest environment [N4]. However, the period also recorded notable cost pressures evident in wage inflation and elevated spend on digital innovation programs aimed at enhancing platform capabilities [S2]. These rising costs have led to some compression in operating margin metrics relative to prior periods.
A recent event filing from late April reaffirmed the company’s commitment to shareholder capital management strategies while maintaining investment discipline for future growth [S3]. No major structural changes were reported but the firm emphasized operational efficiency initiatives ongoing across all segments.
BNY Mellon’s Business Model and Core Service Offerings
BNY Mellon operates as a global financial services platform centered around three primary segments: Securities Services, Market and Wealth Services, and Investment and Wealth Management [S1]. Its sprawling scale is reflected in $59.3 trillion assets under custody or administration alongside $2.2 trillion assets under management as of year-end 2025—figures that underscore significant stewardship responsibilities and cash flow-generating capacity [F1][S1].
Revenue streams derive mainly from fees charged for safekeeping securities, asset servicing including foreign exchange execution and corporate actions processing (Securities Services), wealth advisory fees based on assets administered or serviced (Market & Wealth), and investment management fees tied to assets managed [S1]. This structure creates a diversified revenue base that dilutes reliance on any single stream.
The company’s banking subsidiaries house key trust and custody services alongside banking products supporting the broader client ecosystem, enabling integrated solutions particularly attractive for institutional pension funds, asset managers, corporations, and high-net-worth individuals [S1]. Regulatory licensing barriers combined with platform scale create stickiness; clients face high switching costs due to operational integration complexity.
Technological investments focus on improving collateral management systems — critical given escalating regulatory capital requirements for clients — as well as advancing AI capabilities to streamline operations and enhance risk analytics across the wealth management platforms [S1]. This tech orientation supports client retention while positioning BNY Mellon against agile fintech competitors.
Competitive Environment and Industry Positioning
BNY Mellon stands among a select group of global custodians dominating asset servicing markets alongside peers such as State Street Corporation and Northern Trust. Custody services are highly competitive yet exhibit durable pricing power given the critical nature of these services for institutional investors.
Wealth advisory faces stiffer competition not just from traditional banks but an increasing set of fintech platforms offering digital-first investment advice at often lower cost points [N3]. However, BNY Mellon’s integration of banking products with wealth services provides an edge in client wallet share.
Geographically, regulatory complexity across US/EU/Asia requires substantial compliance infrastructure; BNY Mellon’s established global footprint is a competitive moat limiting new entrants [S1]. Switching costs compounded by service breadth protect fee margins especially within securities services where automation scale matters.
Nonetheless, fintech entrants trigger ongoing innovation pressure necessitating continuous tech upgrades—BNY Mellon’s AI everywhere philosophy is a strategic response designed to maintain service differentiation while managing costs [S1][N1].
Growth Catalysts and Emerging Opportunities
BNY Mellon’s growth drivers are measurable through expanding loan portfolios boosting NII ([N7]), rising fee income propelled by increased asset volumes in Market & Wealth Services ([N4]), plus upselling within investment management mandates leveraging cross-segment relationships [S2][N7].
Digital platform modernization featuring AI-enabled risk analytics improves operational capacity helping attract larger clients requiring complex collateral optimization solutions — thus increasing recurring revenues tied to sophisticated asset servicing [S1][N1].
International expansion into emerging markets offers longer-term opportunity as institutionalization of savings increases demand for custody and wealth advisory products within Asia-Pacific regions where BNY has been selectively growing presence [S1].
Partnerships announced through recent quarters aim to augment product offerings leveraging fintech collaborations especially in digitizing trade processing workflows—these efforts are tracked closely as leading indicators for commercial traction beyond traditional channels [N5][S3].
Risks and Considerations for Future Momentum
Intensified competition coupled with ongoing regulatory scrutiny represent persistent challenges [S1]. Cost inflation manifested prominently in Q1 impacts operating leverage potential; if wage pressures persist or technology investments encounter execution issues margin erosion may deepen [S2].
Further risks include macro volatility affecting asset valuations that underpin fees from custody/administration; sudden shifts could impact top-line predictability given asset sensitivity.
Execution risk is salient concerning wide-scale digital transitions including AI applications which demand front-to-back system integration without disrupting client experience or compliance adherence [S2].
Regulatory capital requirements tied to banking activities require careful balance sheet management amidst debt levels exceeding $30 billion net of cash; inadequate liquidity provisioning could impair flexibility though current financials show ample cash reserves [F1][S4].
Key Near-Term Milestones and What to Watch
Monitoring upcoming Q2 earnings guidance will be crucial for observing whether fee income momentum sustains alongside margin trends given cost dynamics articulated in Q1 disclosures [S2][N5].
Announcements related to strategic partnerships or product launches centered on digitized custody or wealth platforms will serve as tangible KPIs for innovation traction potentially impacting long-term growth mix [N5][S3].
Regulatory developments impacting capital adequacy norms or cross-border operational licenses remain ongoing considerations influencing risk-weighted asset composites affecting profitability forecasts [S3].
Finally, retention rates among large institutional clients during periods of market volatility provide early insight into franchise stickiness amid intensifying competition.
Latest Financial Snapshot: Capital Structure and Performance
Latest financial snapshot
| Metric | Value | Period |
|---|---|---|
| Cash & equivalents | $6.4bn | |
| 2026-03-31 | ||
| Total debt | $32.6bn | |
| 2026-03-31 | ||
| Net debt | $26.2bn | |
| 2026-03-31 |
Source: SEC companyfacts cache [F1].
As of March 31, 2026, BNY Mellon maintained a liquidity cushion of $6.39 billion in cash against a total debt load approximating $32.58 billion resulting in net debt near $26.19 billion—indicative of prudent balance sheet management relative to its business scale [F1]. Annual revenue tallied at $20.08 billion further contextualizes the firm’s operating magnitude supportive of funding ongoing investments while meeting stakeholder expectations.
This analysis is based on publicly filed SEC documents including the most recent quarterly 10-Q dated May 1, 2026 ([S2]), annual report ([S1]), supplementary event filings ([S3]), relevant news coverage () plus up-to-date financial snapshots ([F1]). The commentary does not constitute investment advice but aims to offer an informed perspective suited for buy-side research purposes.
Disclaimer: This is research-only, informational analysis and not investment advice. It may include AI-generated interpretation and general industry context. Always verify important details using primary sources.
Comments