
Alliant Energy’s Q1 2026 Results Reflect Regulated Utility Stability and Renewable Growth
Q1 2026 disclosures emphasize steady regulated utility operations, load growth from key sectors, and ongoing renewable integration in the Midwest.
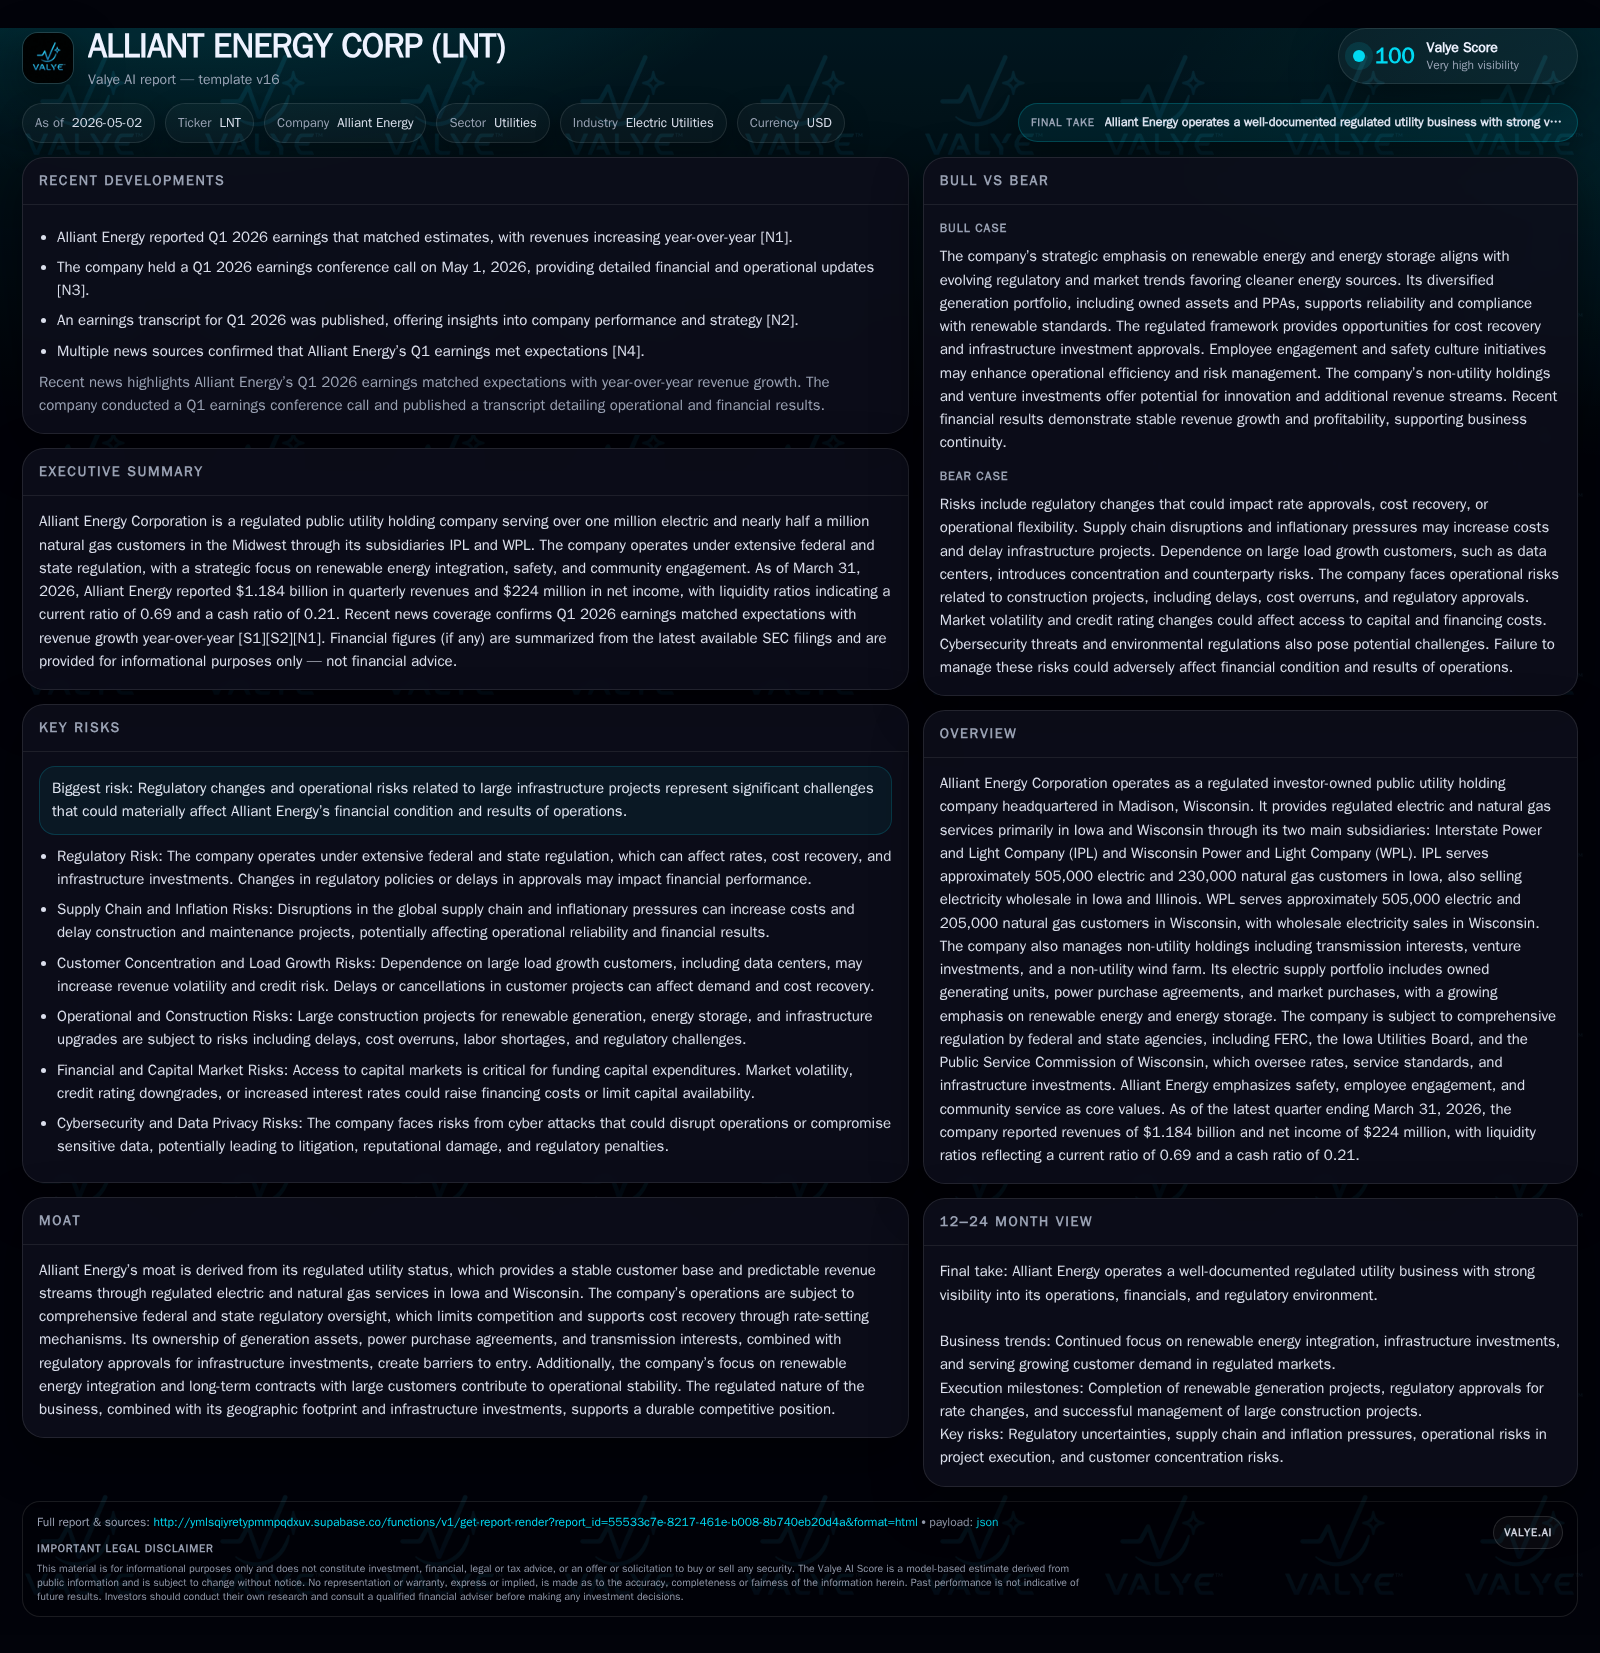
Alliant Energy's Q1 2026 filings confirm stable revenues and earnings consistent with expectations, driven by a broad customer base spread across Iowa and Wisconsin through its regulated subsidiaries IPL and WPL. Growth remains supported by increasing demand from large industrial customers, notably data centers, alongside a strategic shift towards renewable power assets. While regulatory oversight and infrastructure build-out complexity pose risks, the company's regulated business model underpins reliable cash flows and a durable competitive position.
Q1 2026 Operating Highlights and Filing Insights
Alliant Energy Corporation's first quarter SEC filing dated May 1, 2026 ([S2]) presents a continuation of its characteristic stability rooted in regulated utility operations. The quarter's results confirmed revenue growth consistent with the prior year and earnings aligned with analyst estimates ([N1]). The company maintained its substantial customer base of over one million electric customers combined across two primary subsidiaries—Interstate Power and Light Company (IPL) serving Iowa and parts of Illinois, and Wisconsin Power and Light Company (WPL) serving Wisconsin. Gas distribution similarly covers some 435,000 customers between the two utilities ([S1], valye_report_excerpt).
Wholesale power sales continue as supplemental revenue sources within these regions. Management commentary highlights ongoing commitments to increasing renewable energy integration within their capacity mix alongside traditional owned generation assets and market purchases ([S3]). Notably absent are any material changes to risk disclosures in the latest quarterly risk factor section, underscoring a steady operating context for investors ([S26]).
Regulated Utility Business Model and Core Revenue Streams
Overall, Alliant Energy operates under a highly regulated investor-owned holding company model focused on electric and natural gas utilities primarily within the Midwest. Its major subsidiaries IPL and WPL collectively serve approximately one million electric retail customers across Iowa and Wisconsin respectively; IPL also supplies wholesale electricity in Illinois (, [S1]).
Revenue mechanics depend heavily on cost-of-service regulation via state commissions—the Iowa Utilities Board (IUC) for IPL and the Public Service Commission of Wisconsin (PSCW) for WPL—which allow recovery of prudently incurred costs plus a regulated return on invested capital ([S1]). This regulatory framework sets firm barriers against direct competition in franchise territories while enabling stable cash flow visibility through rate cases conducted periodically.
Electric utility operations constitute around two-thirds of total revenues, with natural gas distribution providing complementary streams (). Wholesale energy sales add incremental volume exposure but remain subordinate to core retail activities. Non-utility holdings managed under the subsidiary AEF—including transmission interests (e.g., ATC Holdings), corporate venture investments focusing on emerging energy technologies, a non-utility Oklahoma wind farm (225 MW), and logistics assets—diversify generated revenue streams mildly but remain ancillary ([S16]).
Competitive Position within the Midwest Energy Sector
Alliant Energy’s competitive moat arises from its regulated status supplemented by substantial infrastructure ownership encompassing generation facilities, transmission stakes via ATC Holdings, and exclusive franchise rights enforced by state regulators (, [S22], [S27]). This oligopolistic structure limits market entry risks while underpinning predictable returns.
Regional regulation by the IUC and PSCW imposes stringent oversight over rates charged to customers ensuring cost recovery subject to prudency reviews. Although new entrant threats at retail level are negligible due to regulatory exclusivity, technological shifts such as behind-the-meter self-generation or legislative changes favoring customer-generated power or alternative suppliers could challenge revenue stability over time ([S28]).
Key Growth Catalysts: Customer Demand, Renewables, and Infrastructure
Structural growth drivers center primarily on increased load from large commercial customers including rapidly expanding data centers within Alliant’s footprint—particularly in Iowa—as well as broader industrial demand growth. These large load customers necessitate significant capital investment into generation expansion (including gas-fired peakers) and transmission system enhancements to maintain reliability amid surging demand levels ([S23], [N2]).
Renewable energy integration forms a dual-purpose catalyst: it aligns with state mandates to reduce carbon emissions while diversifying Alliant’s generation portfolio. Expansion of owned wind projects as well as long-term power purchase agreements complements existing assets—reinforcing grid decarbonization goals while hedging fossil fuel price volatility (, [S1]).
However, timely execution of these infrastructure upgrades is crucial given supply chain constraints noted as an enterprise-wide risk potentially delaying project completions ([S23]). Transmission enhancements coordinated with regional entities like ATC are vital for delivering new renewable capacity efficiently.
Risks and Regulatory Challenges Impacting Near-Term Outlook
Despite steady fundamentals, several material risk vectors could impact near-term performance. Regulatory changes remain foremost among concerns; evolving rate-setting policies or environmental legislation may alter allowable cost recovery or impose substantial compliance expenses primarily for legacy fossil fuel assets ([S22], [S27], analysis).
Load concentration risk increases as rapid expansions in data center customers create dependency on relatively few large contracts whose demand profiles may fluctuate due to business cycles or technological efficiency improvements potentially reducing anticipated energy consumption ([S23], analysis). Regulatory delays impacting approvals required for generation capacity or pipeline expansions essential for peak demand periods exacerbate operational risk ([S24]).
Community opposition influencing zoning or siting restrictions for either data centers or associated infrastructure compounds project uncertainty—potentially deferring expected load growth projections (6). These factors combined create execution risk amidst capital-intensive development programs critical to supporting sustained growth.
Milestones and Indicators to Monitor Going Forward
Key performance indicators include regulatory milestones such as rate case decisions by the Iowa Utilities Board and Wisconsin PSC determining allowed returns on equity and cost recovery frameworks which set revenue potential over forthcoming planning horizons (6[S2],[N2]).
Monitoring additions to electric/gas customer counts especially from large load growth segment provides visibility into demand trajectory while wholesale sales volumes reflect auxiliary margin contributions. Capital expenditure progress reported periodically signals project delivery pace important for evaluating timing-related risk premiums.
Financial covenant compliance signals derived from short term liquidity measures following recent credit facility drawdowns will be closely watched given significant ongoing capex demands (6[S2], analysis). Updates regarding corporate venture investments reflect strategic positioning toward emerging technologies within decarbonization initiatives.
Latest Financial Snapshot: Capital Structure and Profitability Metrics
Latest financial snapshot
| Metric | Value | Period |
|---|---|---|
| Cash & equivalents | $115mm | |
| 2026-03-31 | ||
| Total debt | $12.1bn | |
| 2025-12-31 | ||
| Net debt | $12.0bn | |
| 2025-12-31 | ||
| Current assets | $1224mm | |
| 2026-03-31 | ||
| Current liabilities | $1778mm | |
| 2026-03-31 | ||
| Current ratio | 0.69x | |
| 2026-03-31 |
Source: SEC companyfacts cache [F1].
At March-end 2026, Alliant held cash equivalents approximating $115 million alongside current assets totaling $1.22 billion against current liabilities just under $1.78 billion resulting in a current ratio near 0.69 indicative of tight but customary utility liquidity management practices ([F1]). Operating income levels for late FY25 reached about $1.03 billion on revenues exceeding $4.3 billion with net income near $810 million reflecting utility-scale scale efficiencies coupled with structured rate recoveries restraining earnings volatility ([F1]). The company's cost-of-service regulation framework supports steady profitability even amidst deployed capex balancing modernization needs against allowed returns.
This analysis synthesizes information exclusively drawn from Alliant Energy Corporation’s most recent SEC filings alongside related market commentaries without projecting investment outcomes or issuing recommendations.
Disclaimer: This is research-only, informational analysis and not investment advice. It may include AI-generated interpretation and general industry context. Always verify important details using primary sources.
Comments