
Thermo Fisher Scientific’s Q1 2026: Strategic Expansion and Integration Drive Growth Amid Economic Headwinds
Latest quarterly results highlight Thermo Fisher’s resilience through innovation, targeted acquisitions, and global diversification.
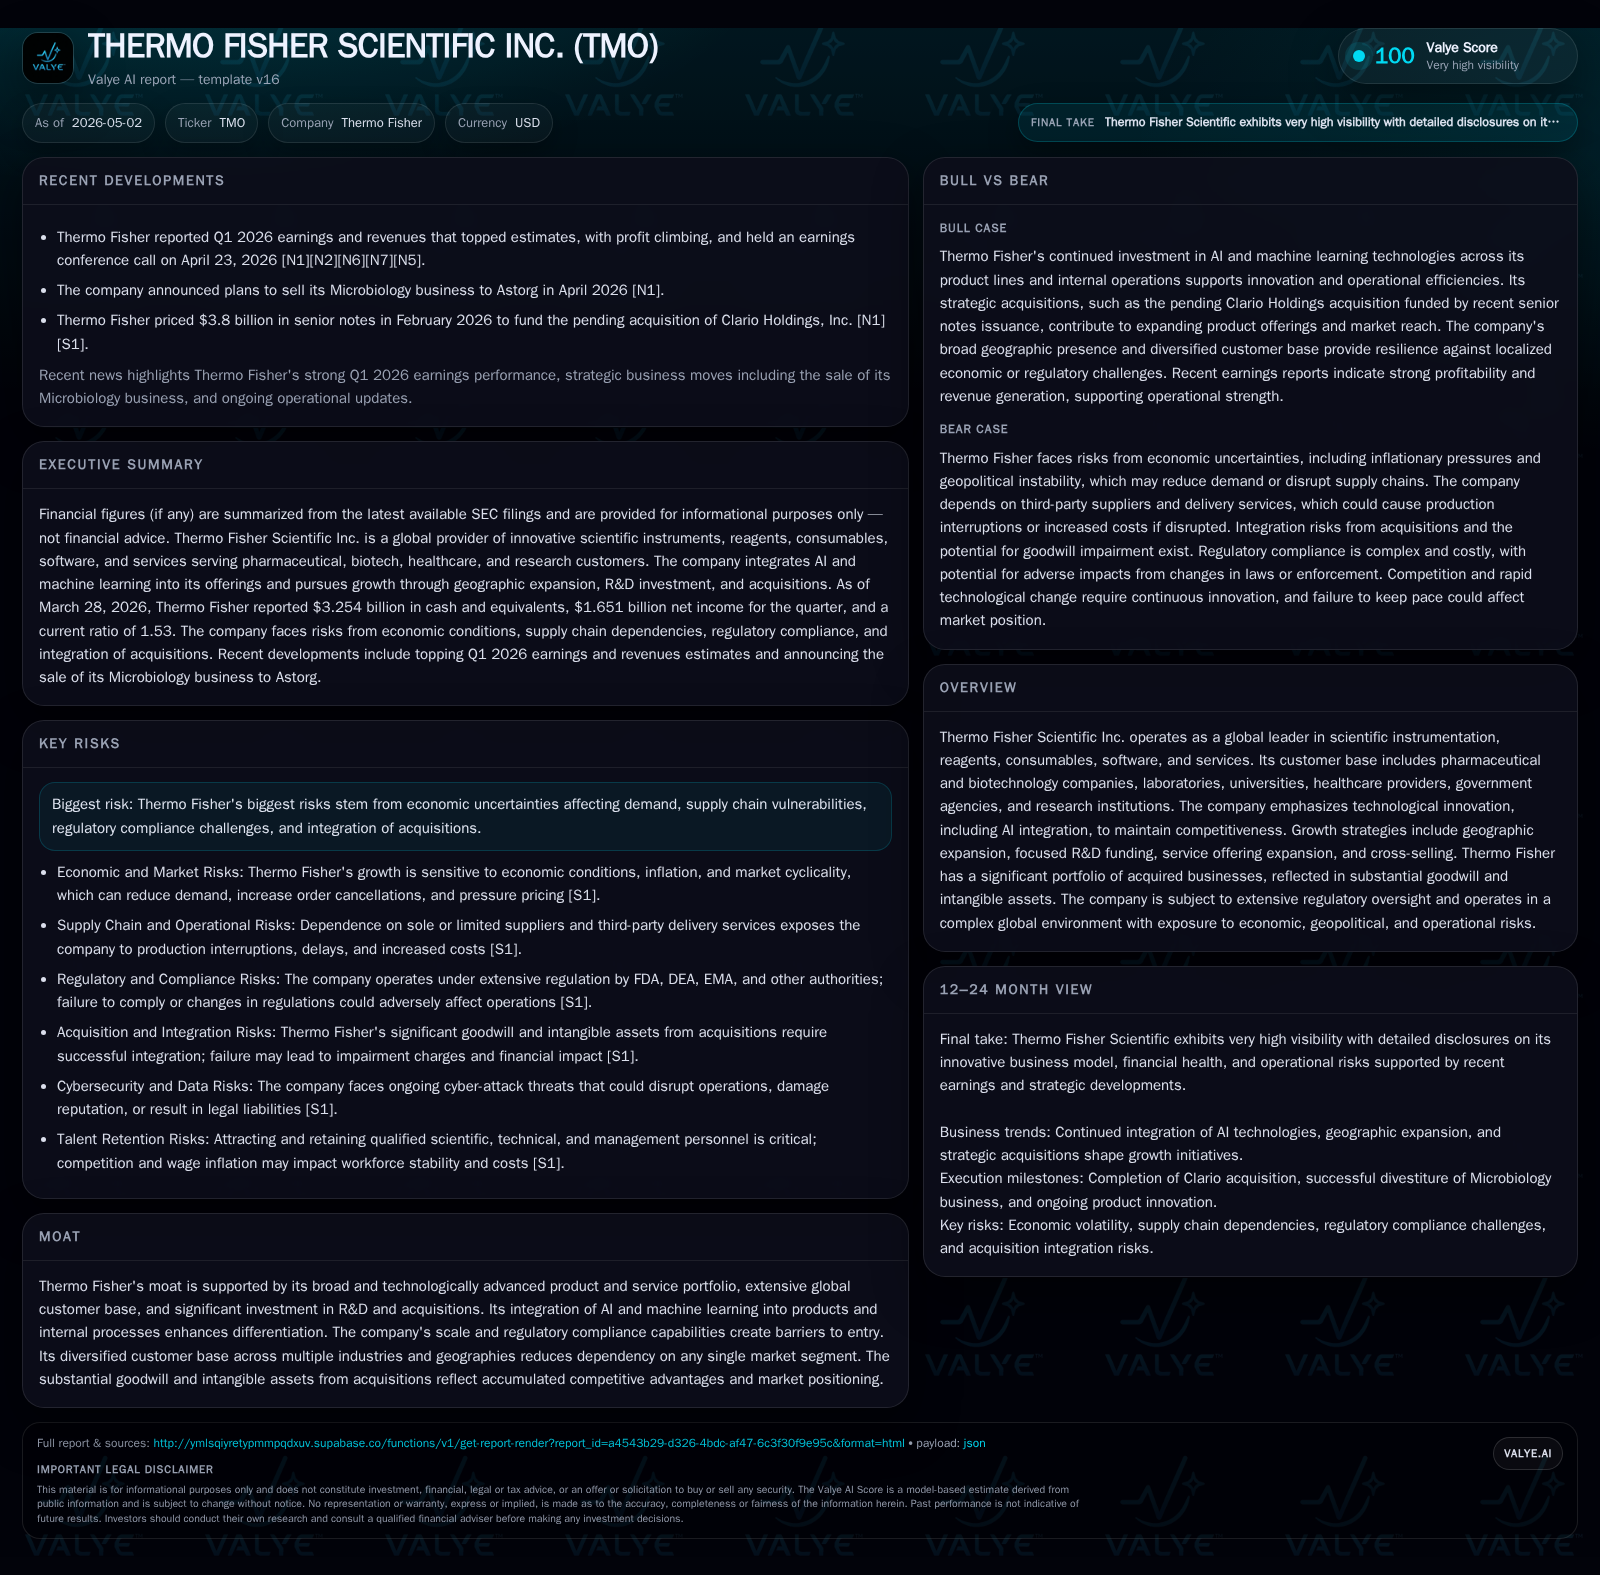
Thermo Fisher Scientific’s Q1 2026 filing underscores sustained demand in key segments driven by pharmaceutical and biotech customers despite macroeconomic uncertainties. The company continues to execute a growth strategy anchored on geographic expansion, AI integration, and service enhancement. Recently announced transactions, including the pending acquisition of Clario, reinforce its commitment to broadening capabilities and market reach. Operational risks persist from supply chains and regulatory environments, yet scale, technological differentiation, and diversified end markets provide significant structural advantages.
Recent Operating Update
Thermo Fisher Scientific's first quarter of 2026 continued to display operational strength despite a challenging macroeconomic backdrop. The company reported revenues exceeding Wall Street expectations, buoyed by robust demand in pharmaceutical development services and analytical equipment sectors [S2][N2]. Emphasis on AI integration within both products and internal processes was reiterated during the earnings call, highlighting its role in enhancing efficiency and customer value propositions [N1].
A significant event is the pending acquisition of Clario Holdings, aimed at expanding Thermo Fisher's clinical trial technology and services capabilities [S8][S9]. The transaction underscores the company’s strategic intent to deepen offerings along the drug development lifecycle. Although closing conditions remain subject to regulatory approvals, liquidity reserves stand robust with a current ratio of 1.53 as of March quarter-end—the cash reserve of $3.25 billion balancing against $43.27 billion total debt or net debt near $40 billion [F1]. This financial posture provides flexibility but mandates disciplined capital allocation given elevated leverage.
Business Model
Thermo Fisher operates as an integrated provider of scientific instrumentation, reagents, consumables, software solutions, and laboratory services tailored predominantly for life sciences research, pharmaceuticals, healthcare providers, biotech firms, government agencies, and academic laboratories [S1]. Revenue is generally generated through direct product sales—often capital equipment requiring lengthy sales cycles—and recurring consumables that capture significant volumes over time. Additionally, service contracts provide steady annuity income streams that encompass instrument maintenance, software subscriptions, and data analytics.
The firm’s growth is driven by volume increases as customers expand R&D activities or scale manufacturing; pricing power afforded by technological leadership; mix enhancements via higher-margin service offerings; and geographic expansion particularly targeting emerging markets showing rising scientific investments [S1][S27][S28]. Cross-selling remains a vital mechanism: about leveraging its diverse portfolio so that clients benefit from bundled technology platforms paired with complementary consumables and services. AI adoption bolsters differentiation by enabling advanced data analytics in instruments or improving operational workflows internally.
Margins benefit from scale economies and product mix tilt toward proprietary technologies but face input cost pressures especially in raw materials like steel or petroleum-based resins critical to manufacturing [S23]. Supply chain dependencies also weigh on production stability due to sole or limited source suppliers for essential components causing potential delays and higher inventory levels [S9].
Industry Structure and Competitive Position
Thermo Fisher sits atop a consolidated yet fragmented life sciences tools & services industry characterized by intense R&D innovation cycles combined with regulatory rigor globally. Competitors range from specialized niche players offering instruments or bio-reagents to large diversified conglomerates with broader healthcare portfolios. Barriers include high capital intensity in manufacturing complex devices, lengthy product development lead times requiring deep technical expertise, stringent regulatory requirements (including FDA/EMA inspections), intellectual property protections, and entrenched customer relationships anchored by long-term contracts.
Competitive moats arise mainly from Thermo Fisher’s extensive portfolio breadth covering instruments to services across multiple sectors enabling cross-selling synergies—it is difficult for competitors to replicate such integrated scale quickly. Significant investment in technology including artificial intelligence adoption fortifies product sophistication relative to peers [S28]. Large global footprint mitigates reliance on single markets exposing it to currency volatility but simultaneously acts as a diversification advantage versus regional peers [S27].
Each driver is measurable by KPIs like backlog growth (reflecting future orders visibility), bookings rate improvements signaling demand traction, renewal rates on service agreements verifying retention strength, pricing trajectory reflecting pricing power amid inflationary pressures, and utilization metrics illustrating capacity deployment efficiencies [N1][S2][S28].
Risks / Watchpoints / Growth Constraints
- Economic Uncertainty Impact: Macro conditions can induce order delays or cancellations especially for capex-heavy products impacting topline rhythm; inflation pressures may squeeze margins if price pass-throughs lag cost inflation [S1].
- Supply Chain Dependence: Sole-source supplier risk exposes operations to interruptions risking production delays or increased merchandise costs; logistics disruptions could delay deliveries raising working capital needs [S9][S23].
- Regulatory Compliance Complexity: Failure to meet evolving FDA/DEA/EMA quality mandates could trigger sanctions including recalls or import restrictions affecting reputation and revenue continuity [S4][S7][S25].
- Acquisition Integration Risk: Large goodwill carries potential impairment risk if acquired businesses fail to achieve forecast synergies; cultural assimilation challenges could erode operational performance post-deal closure [S9].[N11]
- Technological Race: Pace of innovation especially related to AI embedded products demands sustained R&D investment; failure here risks obsolescence relative to agile rivals shortening product lifecycles [S28][N1].
- Geopolitical & Currency Fluctuations: Exposure to international sales subjects results to adverse foreign exchange movements plus regional political instabilities affecting market access or customer confidence [S1][S27].
- Talent Retention: Competition for skilled scientific personnel amid tight labor markets influences innovation capacity alongside operational continuity risks if attrition accelerates unexpectedly [S23].
What to Watch Next
Key milestones over forthcoming quarters will revolve around successful completion of the Clario acquisition alongside realization of expected integration synergies. Monitoring backlog trends coupled with bookings momentum will reveal underlying demand strength amidst economic variability. Regulatory audit outcomes are critical indicators for operational risk control given the company's pharmaceutical manufacturing footprint. Progress in embedding AI within new product releases or service platforms will signal future differentiation sustainability. Pricing behavior versus cost trends will inform margin trajectory assessments given inflation sensitivity. Finally, any updates on supply chain stabilization efforts particularly securing alternate supplier qualification will be telling for future delivery reliability.
Financial Profile Briefly
Latest financial snapshot
| Metric | Value | Period |
|---|---|---|
| Cash & equivalents | $3.3bn | |
| 2026-03-28 | ||
| Total debt | $43.3bn | |
| 2026-03-28 | ||
| Net debt | $40.0bn | |
| 2026-03-28 | ||
| Current assets | $22.3bn | |
| 2026-03-28 | ||
| Current liabilities | $14.6bn | |
| 2026-03-28 | ||
| Current ratio | 1.53x | |
| 2026-03-28 |
Source: SEC companyfacts cache [F1].
As of March 28, 2026 quarter-end summary shows cash & equivalents at ~$3.25 billion balanced against total debt approaching $43.27 billion resulting in net debt ~ $40.01 billion; the current ratio stands comfortably above 1.5 suggesting sufficient liquidity buffers against short-term liabilities totaling approximately $14.62 billion compared to current assets near $22.32 billion providing working capital support [F1].
DISCLAIMER: This analysis is intended solely for informational purposes grounded strictly on disclosed SEC filings and company-related news available as of May 2026 without any investment recommendation or advice.
Disclaimer: This is research-only, informational analysis and not investment advice. It may include AI-generated interpretation and general industry context. Always verify important details using primary sources.
Comments