
Fulgent Genetics Advances Therapeutics Amid Laboratory Services Growth and Customer Concentration Risks
The latest quarter underscores Fulgent’s simultaneous investment in clinical-stage therapies and scaling its diagnostic business, while navigating notable demand concentration.
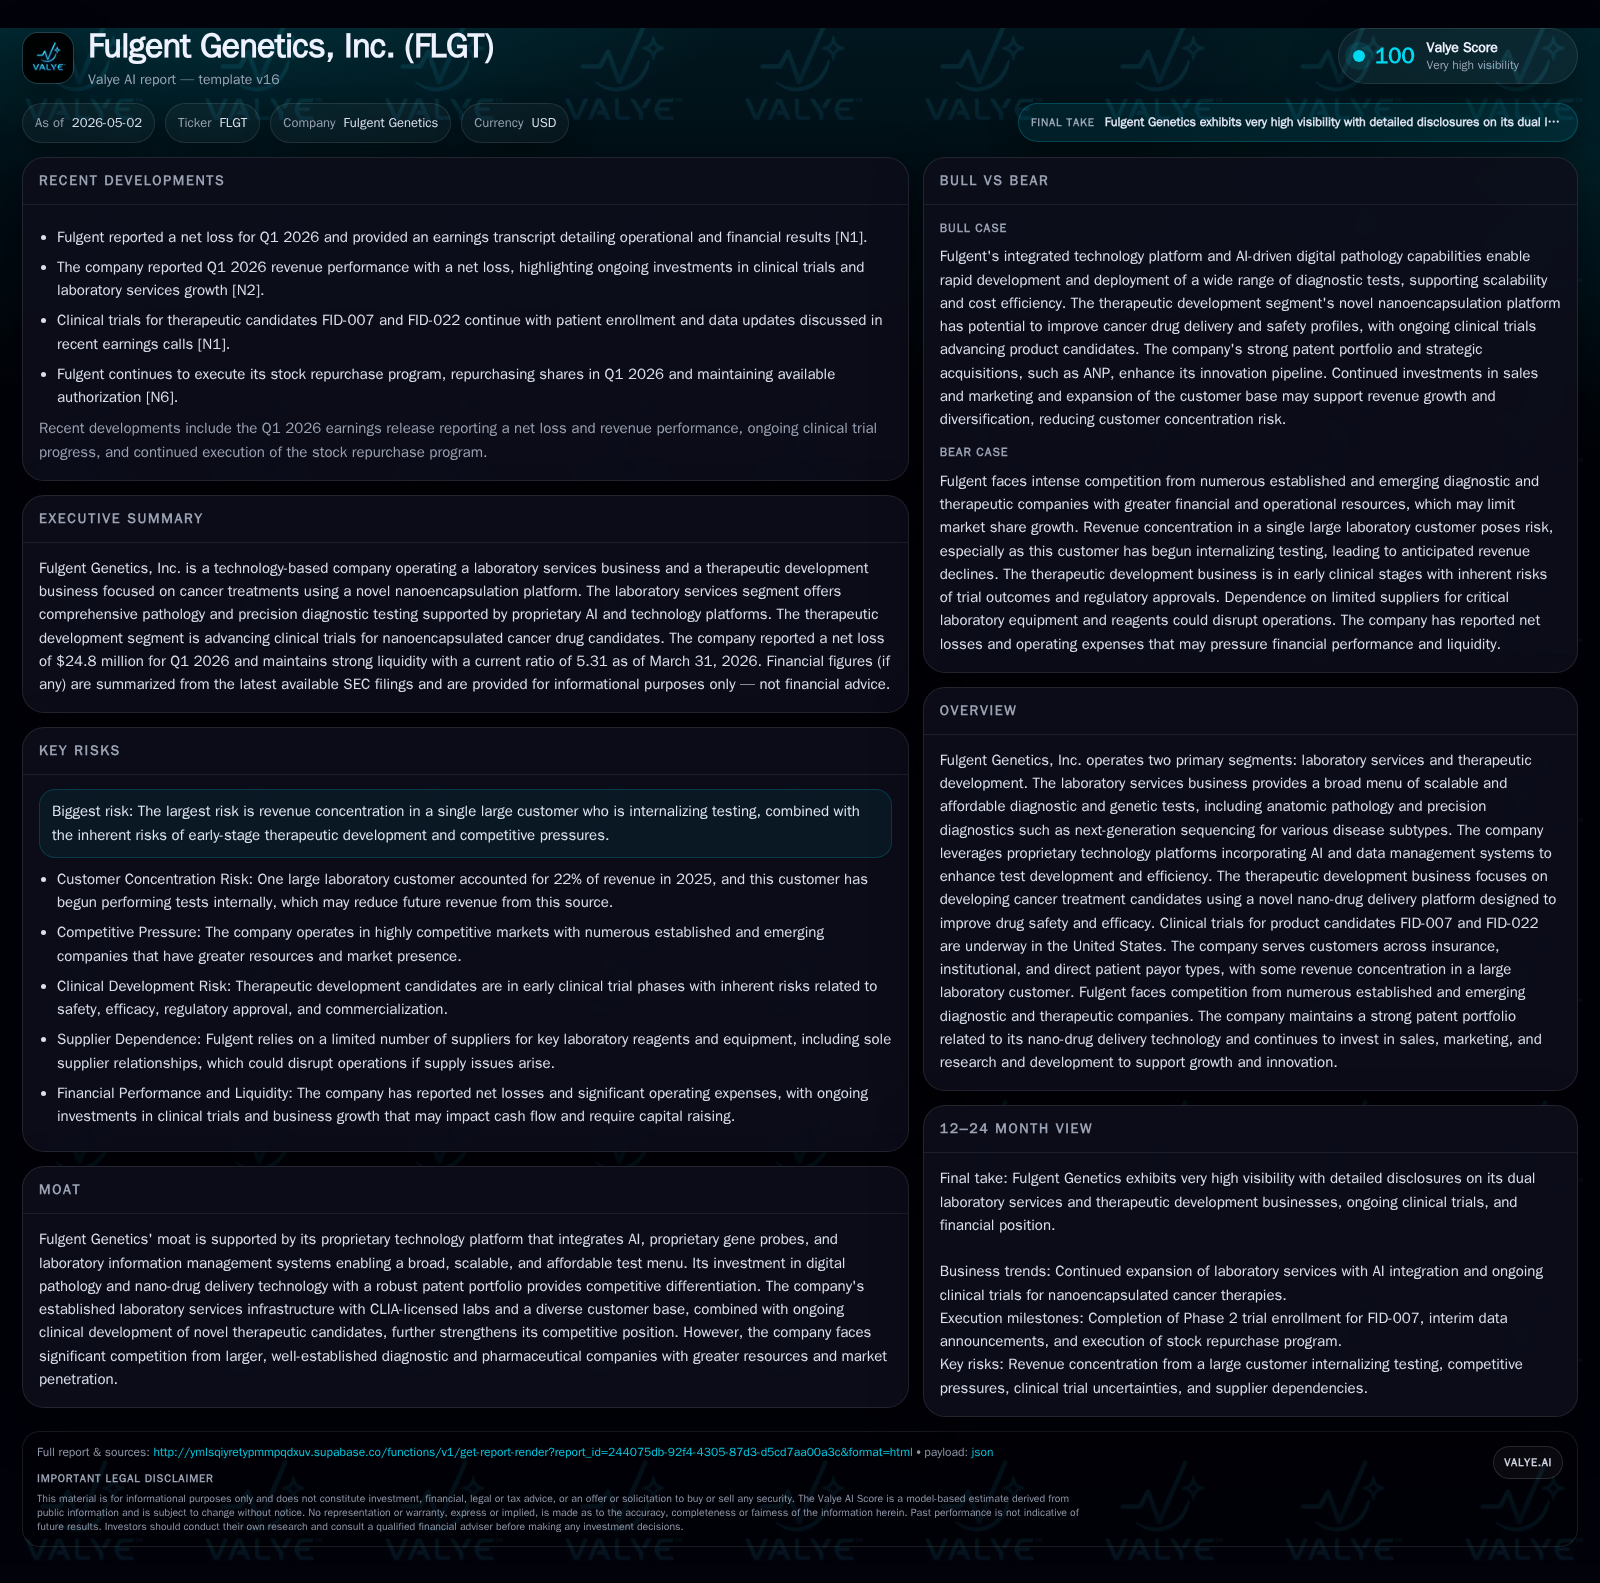
Fulgent Genetics’ Q1 2026 report reveals a key inflection point as it balances expanding its laboratory testing services with advancing clinical trials for cancer therapeutics. Its proprietary AI-enabled diagnostics platform continues to support a broad and scalable test menu. However, revenue concentration from a major customer internalizing tests remains a critical risk. The company’s therapeutic segment is progressing through costly, early-phase clinical trials for FID-007 and FID-022, adding substantial R&D expense and cash burn. Cash flow improved sequentially but operating losses persist amid ongoing strategic investments.
Recent Operating Update
Fulgent Genetics reported Q1 2026 results on May 1st [S2], providing the most current window into its dual-path strategy blending laboratory services leadership with early-stage therapeutic innovation. The company generated $7.1 million in net operating cash flow for the quarter compared to a $4.4 million cash outflow during the same period last year, primarily due to better timing in customer payments alongside ongoing investments in sales and marketing activities aimed at expanding market share in its lab services segment. Meanwhile, investing activities included approximately $55.6 million related to acquisitions supporting expansion [S7]. Cash used in financing was $44.8 million reflecting ongoing share repurchases within an active stock buyback program authorized years prior [S5]. Liquidity remains robust with $23.4 million of cash and equivalents versus total debt of just $0.48 million at March-end translating into a strong net cash position (net debt negative) [F1].
Despite improving operational cash conversion this quarter, Fulgent signals continued elevated expenses as it advances oncology therapeutic candidates FID-007 and FID-022 through clinical trials in the U.S., which entail longer timelines and higher costs typical of early-phase drug development [S2], adding pressure on profitability near term.
Business Model Overview
Fulgent operates two primary segments: Laboratory Services and Therapeutic Development [S1].
Laboratory Services Segment
This segment offers a broad array of diagnostic tests focusing on molecular and precision diagnostics including next-generation sequencing (NGS), anatomic pathology across specialties (e.g., dermatopathology, hematopathology), flow cytometry, cytogenetics, fluorescence in-situ hybridization (FISH), immunohistochemistry, among others. These offerings are supported by a proprietary technology platform integrating artificial intelligence (AI) for digital pathology slide analysis along with proprietary gene probes and data algorithms enhancing throughput efficiency at scale.
Customers span insurance payors, institutional clients such as hospitals and research bodies, with some direct-to-patient testing accessed via telemedicine under the Picture platform brand [S1]. Revenue arises primarily when test reports are delivered to ordering physicians or customers and is subject to contractual adjustments based on payor types.
Therapeutic Development Segment
This emerging business line aims to develop innovative cancer therapeutics leveraging nanoencapsulation technologies designed to improve safety profiles and pharmacokinetics of established or novel drugs [S1]. The lead candidates FID-007 and FID-022 are undergoing clinical trials targeting broad oncologic indications with the goal of transforming treatment paradigms.
Therapeutic development generates limited revenue currently via BioPharma services linked to contract research collaborations but is predominantly an investment-intensive R&D effort requiring significant capital deployment over extended timelines before potential commercialization.
Industry Structure & Competitive Position
In the laboratory diagnostics space, Fulgent competes with large established players such as Invitae, Caris Life Sciences, Foundation Medicine (Roche), Guardant Health, among others offering overlapping precision genomic services. However, Fulgent distinguishes itself through:
- Custom-built proprietary IT infrastructure including AI-enhanced digital pathology enabling scaled slide digitization without traditional microscopy bottlenecks.
- Extensive CLIA-certified labs positioned geographically across the U.S., allowing rapid specimen processing.
- Flexible testing menu spanning common hereditary cancer panels to rare disease diagnostics meeting diverse customer needs.
On the therapeutic front, competition originates from pharmaceutical giants pursuing nano-drug delivery or targeted oncology agents; here differentiation relies upon unique encapsulation platforms combined with clinical validation successes. However, inherent risks exist given resource disparities between large pharma’s global R&D budgets versus Fulgent’s smaller scale.
Growth Drivers
Laboratory Services Expansion
Continued broad adoption of NGS-based precision diagnostics supports structural growth driven by increases in:
- Volume growth fueled by wider clinician ordering patterns.
- New test launches targeting emerging hereditary or somatic mutation subtypes.
- Growing direct-to-consumer engagement through telemedicine platforms increasing patient-initiated testing demand.
- Expansion into pharmaceutical partnerships providing sponsored testing programs.
Therapeutic Pipeline Progression
Successful advancement of clinical-stage product candidates offers optionality for future revenue diversification via potential drug approvals or partnerships/licensing deals that could monetize pipeline assets. Milestones related to trial enrollment rates, safety/efficacy readouts will be key value inflection points.
Technology & Platform Innovation
Ongoing enhancements in AI algorithms for pathology image interpretation and improvements in gene probe designs can drive both operational efficiency gains lowering unit costs as well as improvements in clinical utility attracting more physician uptake.
Risks & Watchpoints
- Customer Concentration Risk: A sizeable portion of lab services revenue derives from one large customer that is progressively internalizing testing operations; loss or decline from this customer could materially impact top-line results [S1].
- Therapeutic Development Uncertainty: Clinical trials may face delays or fail due to safety/efficacy issues; regulatory approvals are uncertain; reimbursement landscape evolves.
- Competitive Pressures: Competition from industry incumbents possessing deeper capital resources poses threats to market share gains particularly if pricing pressures intensify.
- Capital Requirements: Need for continued capital raises or partnerships carries dilution risk or unfavorable deal terms potentially impacting shareholder value if not managed prudently [S2].
- Legal & Regulatory Risks: Ongoing audits/legal investigations require resources; adverse outcomes could inflict financial or reputational damage [S15].
What to Watch Next
Investors and stakeholders should monitor:
- Quarterly updates on clinical trial progress specifically recruitment pace and interim data for lead oncology assets.
- Trend changes in laboratory service volumes by payor category indicative of customer retention or loss dynamics.
- Announcements regarding new test menu expansions or technological platform upgrades leveraging AI capabilities.
- Material changes in customer mix addressing concentration risks or new institutional client wins.
- Capital raise activity announcements reflecting financing strategy amid increased R&D spending.
Financial Profile Snapshot: Q1 2026 Highlights [F1][S2]
Latest financial snapshot
| Metric | Value | Period |
|---|---|---|
| Cash & equivalents | $23mm | |
| 2026-03-31 | ||
| Total debt | $482000 | |
| 2026-03-31 | ||
| Net debt | $-23mm | |
| 2026-03-31 | ||
| Current assets | $479mm | |
| 2026-03-31 | ||
| Current liabilities | $90mm | |
| 2026-03-31 | ||
| Current ratio | 5.31x | |
| 2026-03-31 |
Source: SEC companyfacts cache [F1].
| Metric | Value | Period Ending |
|---|---|---|
| Cash & Equivalents | $23.4 million | |
| 2026-03-31 | ||
| Total Debt | $0.48 million | |
| 2026-03-31 | ||
| Current Assets | ~$479 million | |
| 2026-03-31 | ||
| Current Liabilities | ~$90.1 million | |
| 2026-03-31 | ||
| Net Debt | -$22.9 million | |
| 2026-03-31 | ||
| Current Ratio | 5.31x | |
| 2026-03-31 |
Liquidity remains solid with ample working capital cushion given a current ratio above five times underpinning operational flexibility despite increased expenditures on clinical programs.
Operating losses persist given higher research costs associated with late preclinical/clinical drug development phases alongside investments in laboratory service expansion.[S7]
This analysis is grounded entirely on publicly filed SEC documents dated through May 2026 plus recent reputable news sources as noted. It reflects operating realities without expressing investment advice or forecasts.
Disclaimer: This is research-only, informational analysis and not investment advice. It may include AI-generated interpretation and general industry context. Always verify important details using primary sources.
Comments