
Marriott International Faces U.S. Profit Pressure Despite Fee Revenue Gains in Q2 2026
Marriott’s asset-light franchising model sustains growth amid a challenging operating environment and liquidity constraints.
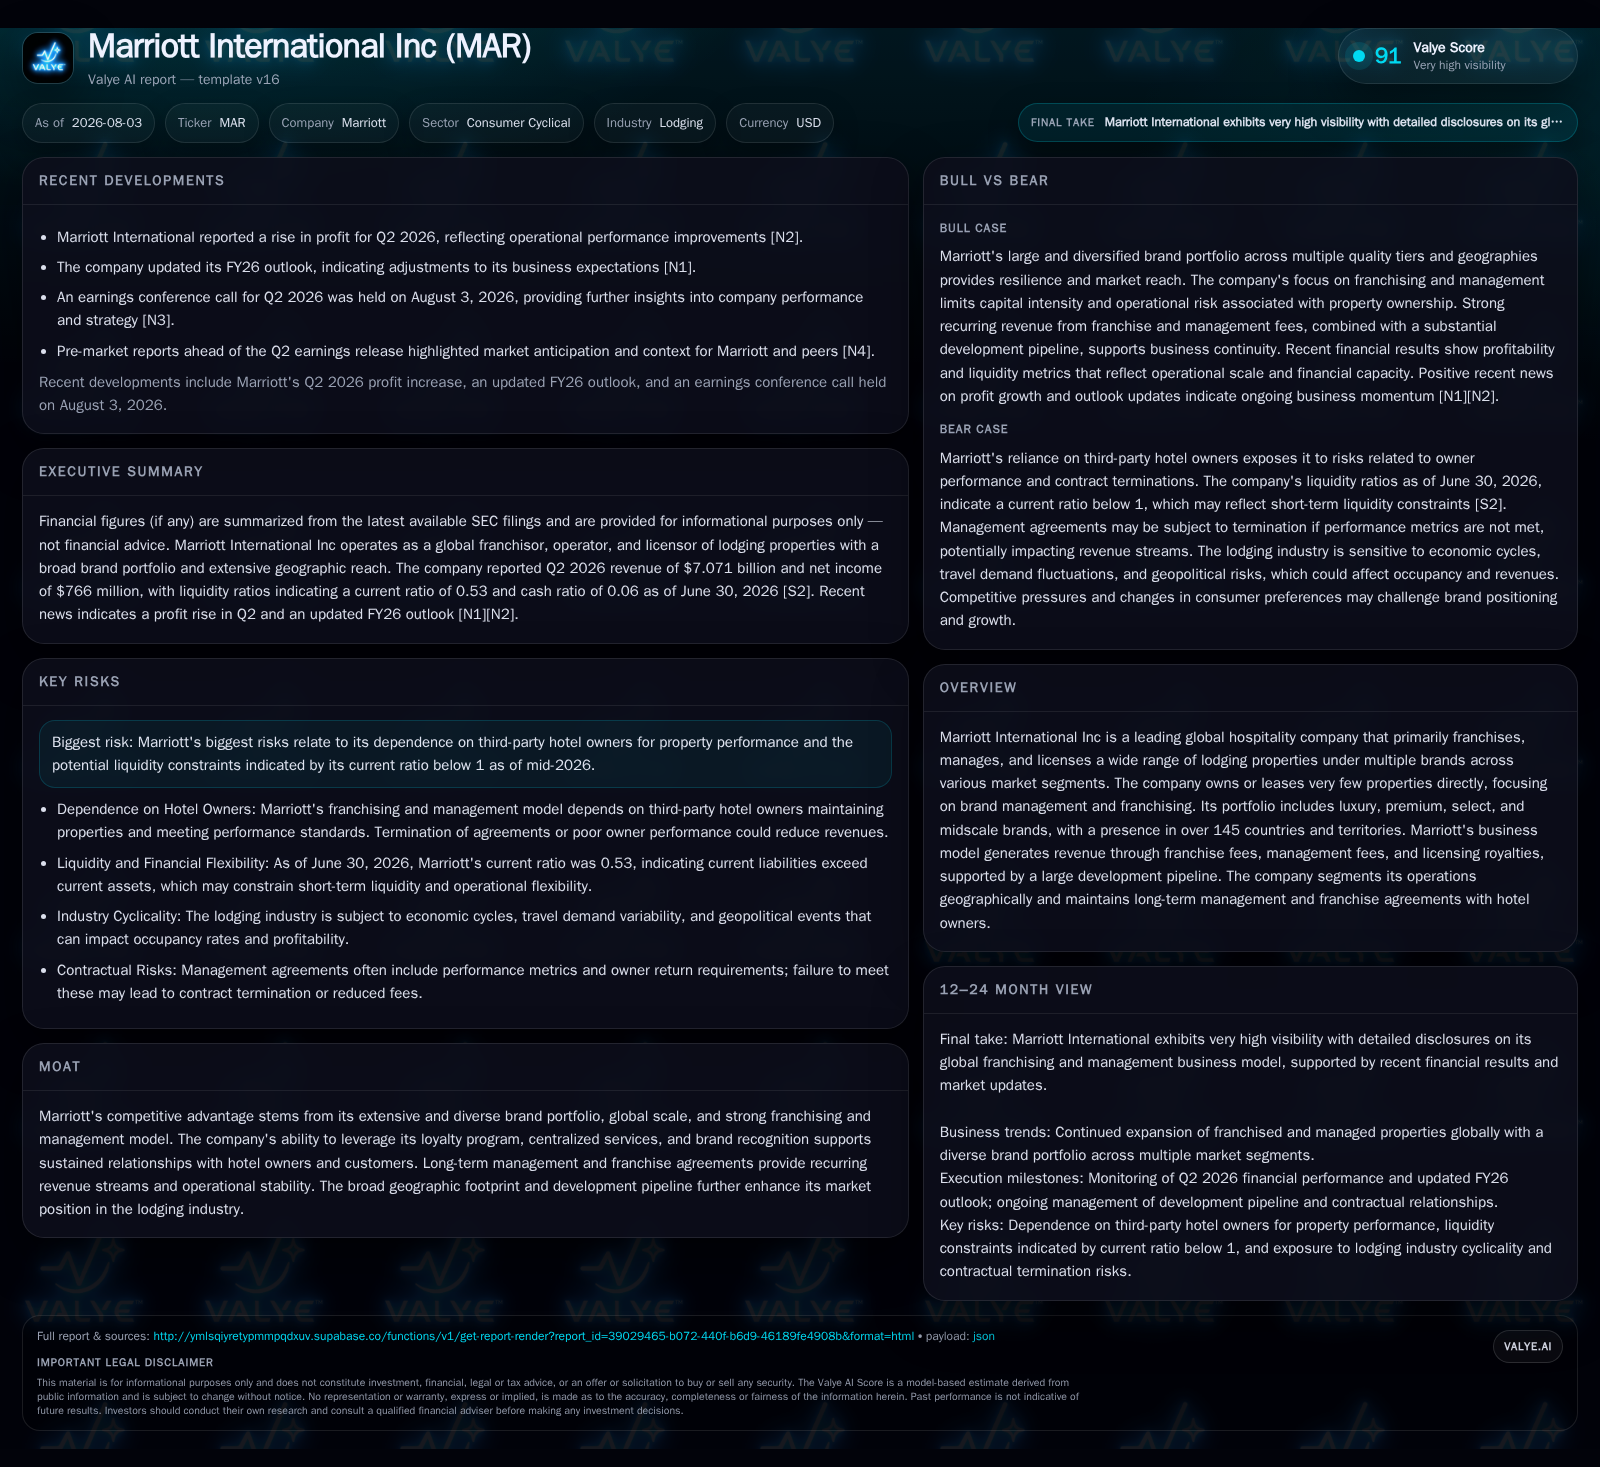
In Q2 2026, Marriott International reported a decline in U.S. & Canada segment profit despite increased net fee revenues, impacted by impairment charges and litigation accruals. The company’s core asset-light business model continues to generate fee-based revenue from franchising and management contracts globally, supported by a diversified brand portfolio and loyalty program. However, profit pressures and a current ratio below 1 highlight liquidity constraints and risks tied to third-party hotel owner performance. Growth is driven by pipeline expansion and loyalty membership, but risks remain from macroeconomic cycles and operational contingencies.
Recent Operating Update
Marriott International’s Q2 2026 results revealed pressure on its U.S. & Canada segment profits despite an uptick in net fee revenues. The decline was largely attributable to a non-cash impairment charge of $68 million related to a hotel designated as held for sale, alongside property-related litigation accruals totaling $27 million and a decrease in cost reimbursement revenue net of reimbursed expenses ($37 million lower) [S2]. These one-time charges partially offset the benefits from increased base fee income reflective of stronger room revenue performance among franchisees and managed properties.
This mixed operating result underscores the nuanced revenue mechanics in Marriott’s asset-light business model: while franchise fees and management fees relate directly to room revenue generated by third-party hotel owners, cost reimbursements correspond to centralized service expenses passed through to owners without direct margin impact but contributing noise to reported segment profits [S1][S2]. The near-term profitability dip highlights how impairments or litigation reserves can transiently affect operating income without fundamentally altering the fee income trajectory.
Business Model Analysis
Marriott operates predominantly on an asset-light model typical for global lodging franchisors and managers. It owns or leases very few properties directly; instead, the company generates revenue through franchise fees (flat or percentage of room revenues charged to franchisees), management fees (based on metrics like base room revenue plus incentive fees linked to property profitability), and licensing royalties for use of its brands [S1]. This produces recurring high-margin fee streams while limiting capital expenditure burdens compared to owned-asset hotel operators.
This model relies heavily on establishing long-term contractual relationships with hotel owners who finance property construction or acquisition. Marriott invests in brand development across multiple segments — luxury (The Ritz-Carlton), premium (Marriott Hotels), select service (Courtyard), midscale (Fairfield Inn)—which allows it to address differentiated market segments globally [S1]. Furthermore, Marriott leverages its Marriott Bonvoy loyalty program as a strategic asset to drive direct bookings and customer retention, strengthening brand preference among travelers.
Key operational drivers include the number of rooms under management or franchise agreements (“rooms in system”), occupancy rates at those properties dictated by external travel demand cycles, average daily rate (ADR) set largely by local market conditions, which combine into revenue per available room (RevPAR) [S1]. Fee revenues scale with RevPAR increases and expanding footprint via new hotels entering Marriott’s system through pipeline development projects under franchise or management contracts
Industry Structure and Competitive Position
Marriott competes within the highly fragmented global lodging industry against other large franchisors/managers such as Hilton Worldwide, Hyatt Hotels, InterContinental Hotels Group, Choice Hotels, as well as emerging alternative lodging platforms including Airbnb that disrupt traditional hotel stays. Its scale — present in over 145 countries — along with broad brand segmentation helps mitigate competitive pressures localized within particular markets.
The company’s competitive advantage stems from its extensive brand portfolio catering across price tiers combined with loyalty program scale (~160 million members estimated), which increases switching costs for customers preferring consistent rewards redemption [S1]. Additionally, Marriott benefits from centralized marketing and operational expertise shared across its system that create efficiencies unavailable to smaller regional chains or independent hotels. This ecosystem reinforces franchisee trust supporting renewal of contracts generating stable recurring revenues over time
Despite this strength, competition remains fierce especially from digital-native platforms offering alternative lodging options often at lower prices or localized niches which can erode pricing power or occupancy rates particularly in urban or leisure destinations where supply growth is rapid.
Growth Drivers
Looking forward Marriott aims to expand primarily through increasing its hotel rooms in system by securing new franchise agreements in growing markets worldwide. A robust pipeline development positions it well for future growth; this includes not only conventional hotels but also differentiated offerings such as ‘Homes & Villas by Marriott Bonvoy’, targeting premium/vacation home rentals under the corporate umbrella [S1].
Technology investments are another key growth lever with ongoing transformation projects enhancing direct booking channels through digital platforms embedded with personalized loyalty incentives carrying better margins than third-party booking intermediaries.
Additionally, co-branded credit card partnerships deepen customer engagement by linking everyday spending with loyalty point accumulation driving more frequent stays.
International expansion in Asia Pacific and Greater China remains promising due to rising disposable incomes and domestic travel surge post-pandemic era restrictions easing observed broadly across these regions.
Risks / Watchpoints / Growth Constraints
While Marriott’s asset-light model reduces many capital risks associated with owning hotels outright, it creates dependency on third-party hotel owners’ financial stability and operational success which can be influenced adversely by macroeconomic downturns reducing travel demand or localized disruptions impacting property performance [S1].
A current balance sheet concern arises from liquidity constraints as reflected by the company’s current ratio of approximately 0.53 at the end of June 2026 (current assets $4.23B vs. current liabilities $7.90B), signaling short-term working capital tightness [F1][S2]. Total debt stands near $16.5 billion with net debt around $16 billion after subtracting cash balances – indicative of leverage that necessitates careful debt servicing management amidst interest rate volatility.
Another risk area relates to litigation charges—as shown with the recent property-related accrual—and potential impairments if ownership changes or market declines reduce asset values below carrying amounts triggering further write-downs that adversely impact profit.
Competitive threats from alternative lodging platforms persist alongside evolving consumer preferences that may challenge brand loyalty unless Marriott continuously innovates its customer experience through loyalty enhancements and tech upgrades.
What To Watch Next
Market participants should monitor following key indicators for signals on Marriott’s operating trajectory:
- Segment profit trends by major geography (U.S. & Canada vs international) particularly watching if impairment/litigation charges stabilize or recur,
- Pipeline additions measured by number of rooms contracted vs openings announced,
- Fee revenue growth coupled with RevPAR shifts reflecting pricing power amid inflationary/deflationary environments,
- Cost reimbursement dynamics that can obscure core fee profitability,
- Loyalty program membership changes signaling customer engagement levels,
- Liquidity metrics especially changes in current ratio or debt refinancings/extensions,
- Execution timelines for technology system transformations impacting direct booking margins,
- Legal proceedings updates related to property litigation exposure.
Financial Profile Discussion
As of June 30, 2026 Marriott held approximately $462 million in cash & equivalents against total debt estimated at $16.45 billion yielding significant net leverage at about $16 billion net debt including commercial paper borrowings [F1][S2]. The company recently issued $600 million Series WW Notes due 2033 bearing 4.5% coupon plus $850 million Series XX Notes due 2038 at 5.1% coupon to refinance debt maturities and fund general corporate purposes including share repurchases [S2]. Interest payments are semiannual starting November 2026 potentially impacting cash flow requirements going forward.
Operating cash flow generation remains strong; net income stood near $1.4 billion for the first half of 2026 supported by disciplined expense controls although impacted by non-cash impairment recognition expenses [S2]. Capital expenditures are moderate given the asset-light model but include technology investments projected between $1.05 billion–$1.15 billion annually inclusive of loan advances expected later this year related to strategic deals like Lefay investment [S2][S5].
Share buybacks continue as part of capital return strategy indicating management confidence in generating sustainable free cash flow despite leverage levels [S5][S8]. However, ongoing vigilance is warranted given the low current ratio signaling working capital challenges requiring portfolio optimization or financing solutions.
Report prepared following latest quarterly disclosures maintaining focus on operational realities shaping Marriott’s competitive positioning within the evolving lodging sector structure without providing investment research views.
Disclaimer: This is research-only, informational analysis and not investment advice. It may include AI-generated interpretation and general industry context. Always verify important details using primary sources.

Comments