
Marcus Corporation's Strategic Response to First Quarter Operational and Financial Dynamics
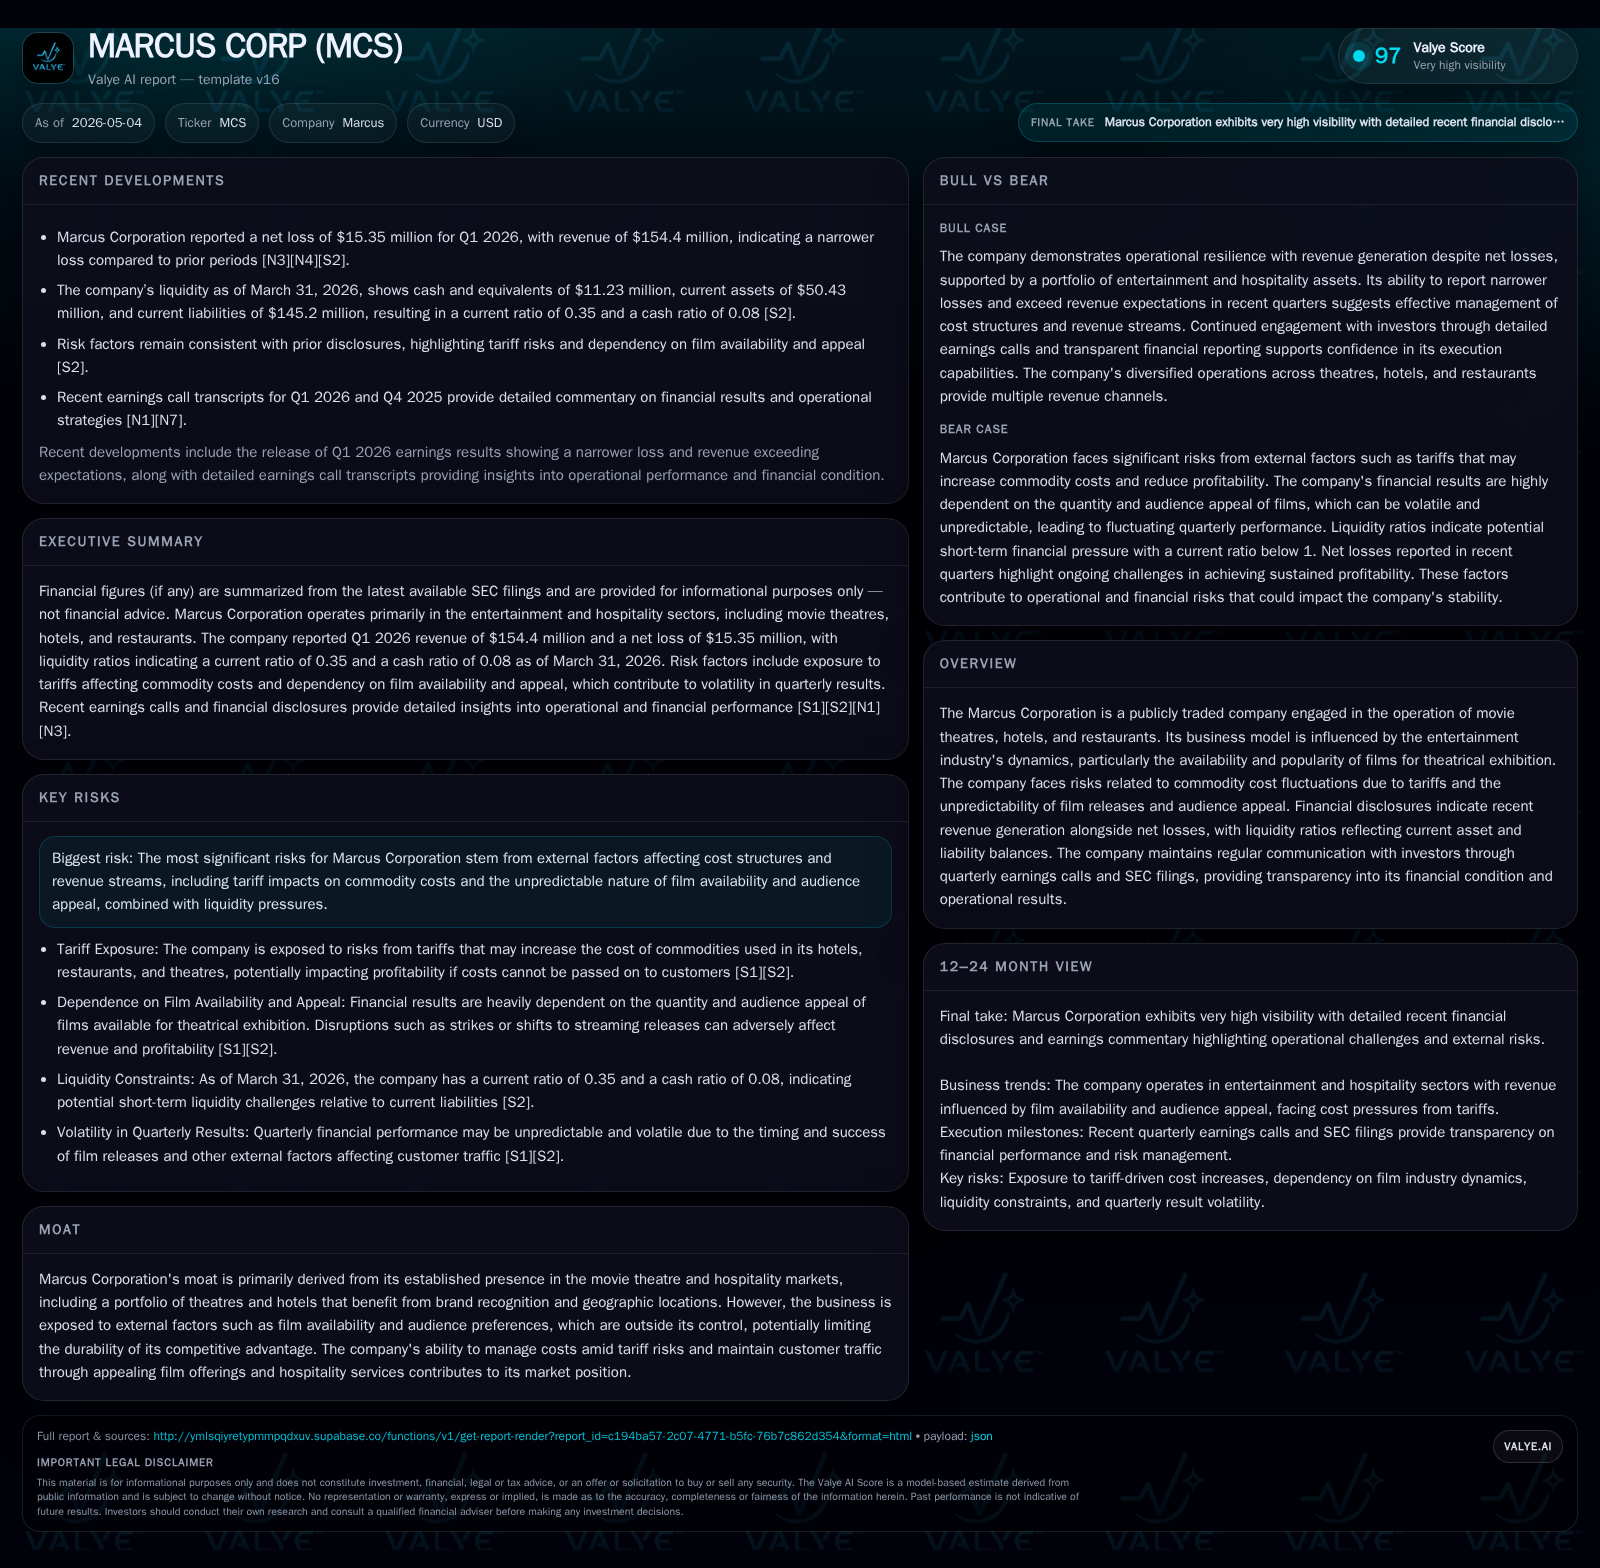
Marcus Corporation narrowed losses and surpassed revenue expectations in Q1 2026 while navigating volatility in entertainment demand and tariff-driven cost pressures.
In its latest quarterly filing ending March 31, 2026, Marcus Corporation reported improved revenue performance with a narrowing net loss despite ongoing challenges from film slate variability and rising commodity costs influenced by tariffs. The dual business model—comprising theatrical exhibition and hospitality operations—faces cyclical demand sensitivities tied to film availability and audience preferences alongside external cost inflation risks. Management continues to focus on enhancing theatre amenities and operational efficiencies while monitoring liquidity constraints reflected in a low current ratio. The company’s established geographic footprint and integrated service offerings provide some competitive insulation, but execution on growth initiatives and cost management will be critical amid persistent sector headwinds.
Latest Quarterly Operating Update Highlights
Marcus Corporation’s first quarter filing for the period ended March 31, 2026 reflected notable operational adjustments amid a challenging entertainment landscape. Revenue exceeded analyst expectations as box office receipts demonstrated resilience despite ongoing slate variability—a chief driver of foot traffic unpredictability in theatrical exhibition [S2],[N3]. Concurrently, the company reported a narrowing net loss compared to previous quarters, underscoring progress in cost control initiatives even though profitability remains elusive [S2],[N3]. Hospitality operations experienced mixed demand trends with hotel occupancy rate softness offset partially by steady restaurant patronage.
The quarterly report reaffirms no material changes to risk factors compared to the prior annual disclosure—specifically highlighting tariff-related commodity cost pressures remain an unresolved headwind [S2]. A recent event filing detailed executive leadership succession at Marcus Theatres with Jeffry F. Tomachek succeeding Mark A. Gramz as President, signaling continuity while potentially injecting fresh operational focus [S3]. This personnel transition is strategically important given theatres’ centrality to the revenue mix.
Marcus Corporation’s Business Model: Theatres and Hospitality Synergies
Marcus operates two complementary segments: movie theatres primarily generating revenue via ticket sales plus per patron food & beverage spend; and hospitality units comprising hotels and restaurants contributing through room rates, banquet services, and menu pricing [S1]. The theatre business hinges critically on year-over-year box office variability driven by studio film slates—a structural cyclicality difficult to hedge but buffered by premium offerings such as reserved seating and enhanced amenities aiming to increase average ticket price.
Hospitality revenues correlate with transient travel volumes though local market dynamics impact pricing power more directly than theatres. Tariff-induced commodity cost increases—affecting inputs like foodstuff for restaurants or energy costs for hotels—squeeze margins if price hikes risk reducing consumer demand [S1],[S25],[S26]. Marcus attempts incremental pricing but faces elastic demand scenarios given competition from alternative entertainment options and evolving consumer preferences. Nonetheless, the integrated nature of its business allows cross-promotion synergies (e.g., bundling hotel stays with theatre experiences) that can enhance customer retention.
Industry Environment and Competitive Positioning
The movie exhibition industry contends with significant structural challenges including increasing content release fragmentation between theatrical windows versus direct-to-streaming premieres [S1],[N1]. Film availability remains less predictable post-pandemic exacerbated by labor disruptions in Hollywood during prior years [S26],[S27]. These factors generate volatile quarterly revenues tied closely to blockbuster releases timing.
Competition spans large national chains wielding scale economies and technology investments (premium large format screens, loyalty programs) alongside regional operators focusing on localized markets. Pricing power is limited by consumer alternatives particularly streaming platforms reducing theatrical attendance elasticity [N1]. Meanwhile, the hospitality segment faces intense rivalry from both branded hotel chains enforcing brand standards and independent operators competing on service differentiation.
Marcus’s market positioning benefits from established geographic penetration in Midwest U.S., recognized brand equity in both segments, and investments in theater experience upgrades designed to enhance customer dwell time and per-customer spending [S1]. However, the leverage over movie studios’ film release decisions is minimal.
Key Growth Drivers and Expansion Opportunities
Revenue growth levers center around enhancing customer experience—upgrading auditoriums with recliners or optical technologies can lift average ticket prices while boosting attendance frequency for loyal patrons [N2]. Food & beverage innovation targeting higher margin offerings represents another path to grow ancillary revenues within theatres.
Hospitality efforts include brand upgrades to improve room rates and capitalize on meeting/conference segment recovery. Selective geographic expansions target high-growth metro areas promising higher occupancy rates supported by tourism or business travel trends.
Management has highlighted strategic investments aimed at operational efficiency improvements to absorb tariff-driven input inflation without fully passing costs onto consumers thereby preserving traffic levels [N1],[S3]. Digital marketing enhancements improving customer acquisition costs complement these physical asset investments.
Principal Risks and Constraints Facing Marcus Corporation
The dominant risks remain twofold: first, tariff-driven commodity cost inflation affecting foodservice supplies, utilities, and other inputs which compresses margins especially if price increases deter customers; second, unpredictable content supply restricting box office appeal creating volatile cash flow patterns quarter-to-quarter [S1],[S25],[S26].
Financial constraints emerge from liquidity challenges: as of Q1 2026 the company’s current ratio stood at a depressed 0.35 reflecting significant current liabilities relative to assets alongside $175 million total debt with about $11 million in cash reserves yielding net debt around $164 million [F1].
Additionally, management transitions at key theatre leadership roles pose execution risk during a sensitive operational phase [S21]. Macro factors such as economic downturns or sustained shifts toward home entertainment could further suppress demand.
Upcoming Catalysts and Monitoring Points
Critical near-term milestones include evaluation of upcoming major studio release schedules which will serve as leading indicators for theatrical segment demand stabilization or deterioration [N1]. Management commentary during future earnings calls regarding tariff developments or raw material sourcing strategies offer early warnings on cost pressure trajectories.
Operational rollout updates related to theatre amenity expansions or hospitality refurbishments will signal strategic capital deployment effectiveness. Market reaction to executive leadership changes in Marcus Theatres will also merit close observation given their influence on day-to-day operational momentum.
Financial Overview: Liquidity, Leverage, and Profitability Snapshot
Latest financial snapshot
| Metric | Value | Period |
|---|---|---|
| Cash & equivalents | $11mm | |
| 2026-03-31 | ||
| Total debt | $175mm | |
| 2026-03-31 | ||
| Net debt | $164mm | |
| 2026-03-31 | ||
| Current assets | $50mm | |
| 2026-03-31 | ||
| Current liabilities | $145mm | |
| 2026-03-31 | ||
| Current ratio | 0.35x | |
| 2026-03-31 |
Source: SEC companyfacts cache [F1].
| Metric | Latest Value |
|---|---|
| Cash & Equivalents | $11.23 million (Q1'26) |
| Total Debt | $175 million (Q1'26) |
| Net Debt | $163.77 million (Q1'26) |
| Current Assets | $50.43 million (Q1'26) |
| Current Liabilities | $145.20 million (Q1'26) |
| Current Ratio | 0.35 |
Liquidity remains constrained given the low current ratio and significant net debt levels. Narrowing net losses observed this quarter offer cautious optimism but sustained profitability requires execution against multiple operating risks simultaneously [F1],[S2].
Disclaimer: This is research-only, informational analysis and not investment advice. It may include AI-generated interpretation and general industry context. Always verify important details using primary sources.
Comments