
MDU Resources’ Shift to Pure-play Regulated Energy Delivery Amid Tariff Inflation and Capital Intensity
MDU Resources fully spun off non-core construction services to sharpen focus on regulated electric and natural gas delivery, confronting cost pressures and capital demands.
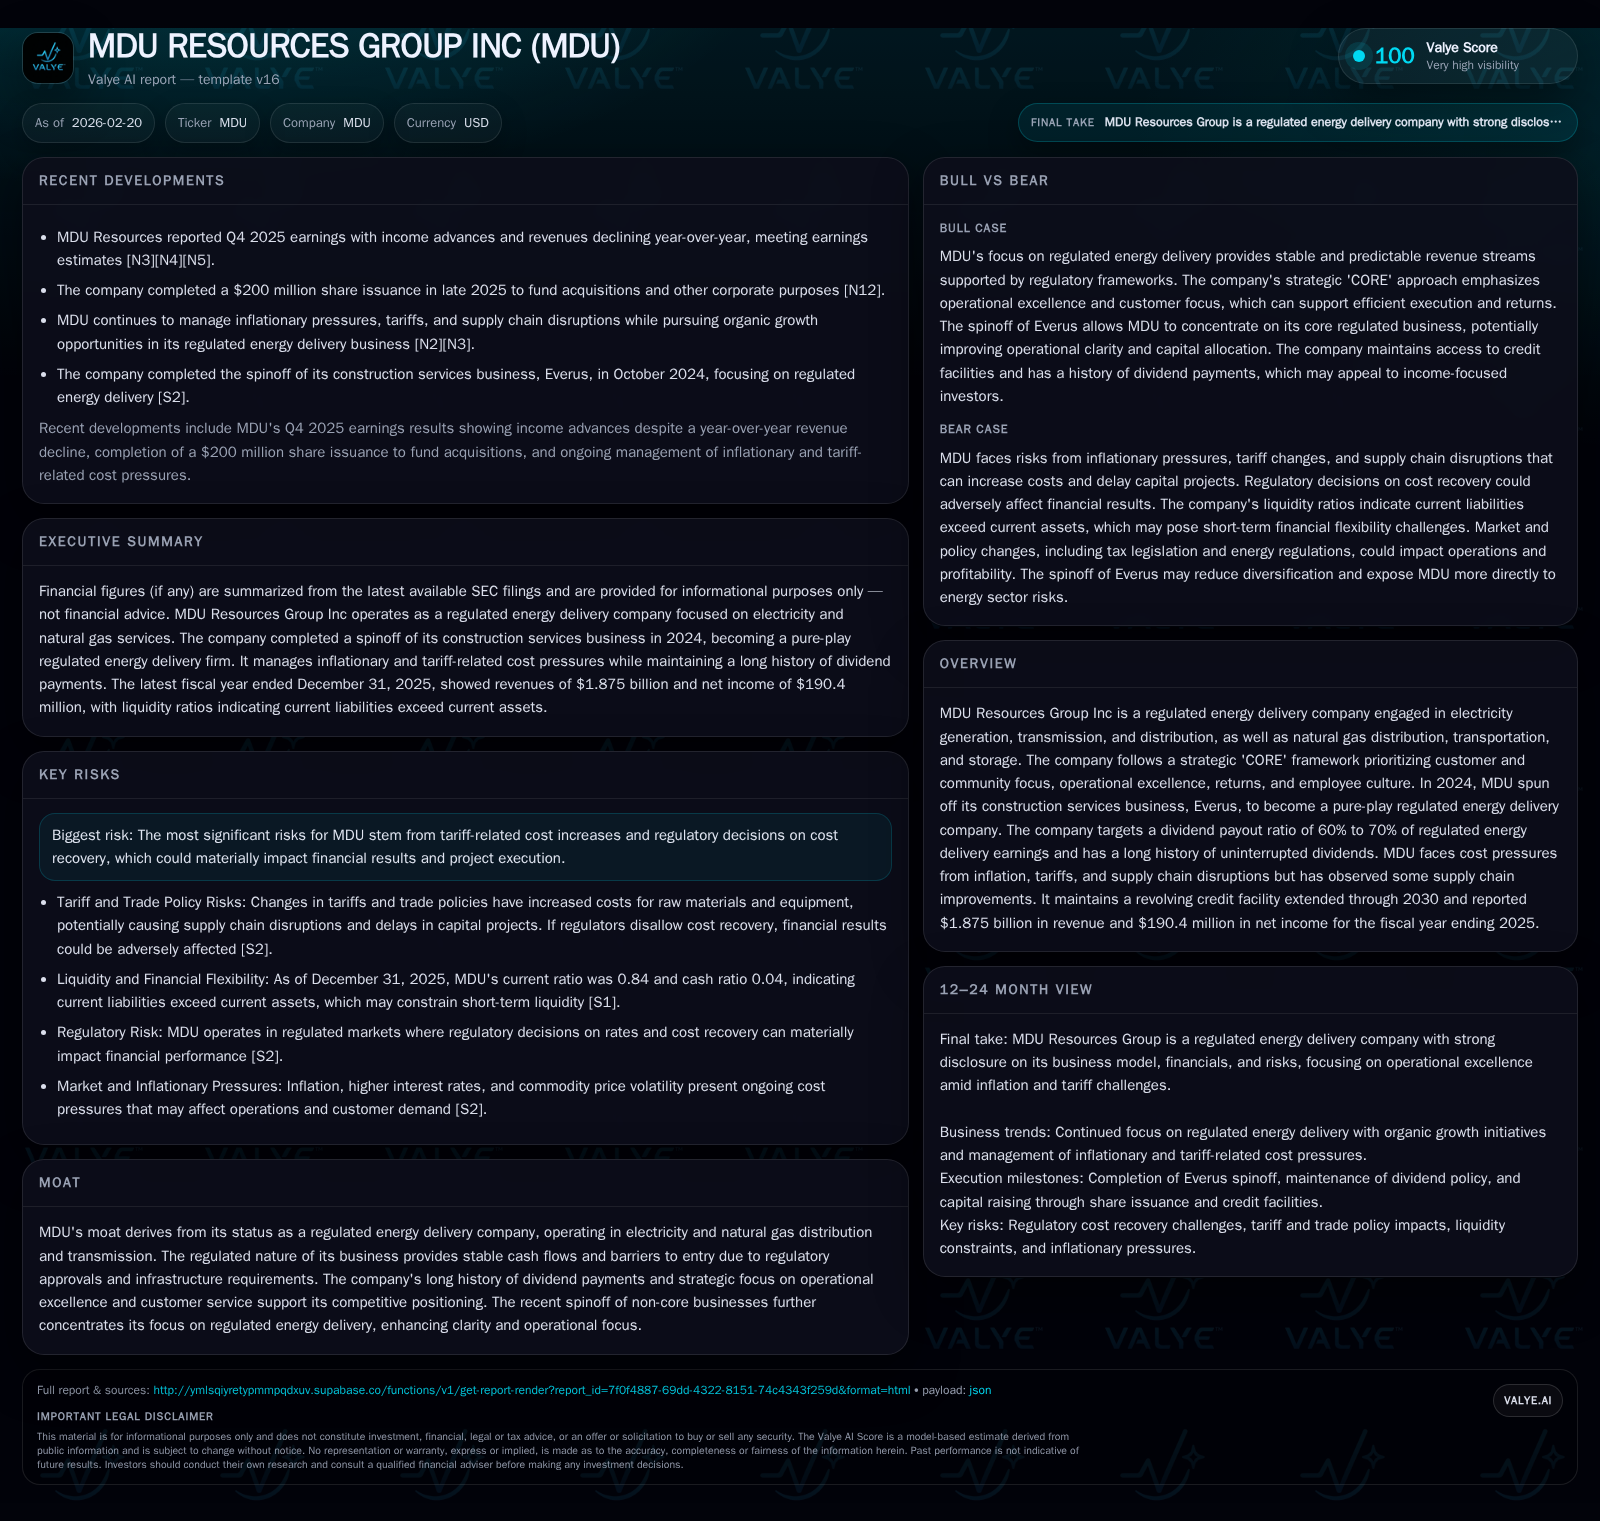
MDU Resources Group Inc transitioned to a pure-play regulated energy delivery company after spinning off Everus in late 2024, focusing on electricity generation, transmission, and natural gas distribution. The company’s historical revenue growth slowed but remained positive in 2025 with continued margin pressure due to inflation, tariffs, and supply chain challenges. MDU’s capital allocation prioritizes dividends backed by a targeted payout ratio of 60-70% of regulated earnings, though elevated capex requirements have led to negative free cash flow recently. Future growth hinges on regulatory cost recovery policies and organic expansion within its regulated framework, while financial flexibility is supported by extended revolving credit facilities. Return metrics such as ROE are approximately 6.9% for FY2025 based on reported net income and equity. Operating cash flows remain strong but free cash flow was negative due to increased capital expenditures. No share repurchases occurred in FY2025 following prior modest buybacks pre-spin-off [F1][S2][S6].
Background and Recent Strategic Realignment
MDU Resources Group Inc underwent a significant transformation by completing the spin-off of Everus, its construction services subsidiary, in October 2024 [S2]. This reorganization marked MDU's transition into a pure-play regulated energy delivery company, concentrating on electricity generation, transmission/distribution, natural gas distribution, transportation, and storage [S1][S8]. The spin-off aimed to sharpen operational focus under the company’s 'CORE' strategic framework centered on customer/community engagement, operational excellence, returns optimization, and employee culture [S2].
The Everus separation was executed as a tax-free spinoff for U.S. federal tax purposes (excluding certain fractional shares), reallocating assets while incurring one-time separation costs mostly realized through 2024 [S2]. Post-spin, MDU divested non-regulated business exposure, augmenting clarity for investors on its core utility business dynamics.
Historical Performance Overview
Following the spin-off's impact on comparability, MDU reported revenues of approximately $1.875 billion for FY2025 representing a year-over-year increase of about 6.7%, improving from $1.758 billion in FY2024 [F1]. Notably, FY2023 and FY2022 displayed anomalously large revenue figures ($4.657B & $6.974B respectively) reflecting prior consolidated operations with Everus included before its spinoff.
Operating income rose from $265.6 million in FY2024 to roughly $290.4 million in FY2025 (+9.3%), evidencing moderate margin resilience during inflationary headwinds [F1]. However, net income declined sharply from $281.1 million to $190.4 million (-32%) likely due to elevated costs related to restructuring and inflation impacts not fully offset by pricing or efficiency gains [F1].
Operating cash flow diminished slightly by ~5.8% to about $473 million while capital expenditures jumped nearly 47% reaching over $770 million in FY2025 from roughly $523 million the prior year – illustrating heightened investment intensity focused on infrastructure modernization within regulated franchises [F1]. This dynamic drove free cash flow (operating cash flow less capex) into negative territory (-$297 million), which is not uncommon for capital-intensive utilities during growth or renewal cycles but highlights funding pressure points [F1].
Financial Summary Table
Historical performance (annual)
| FY | Rev ($bn) | Net ($mm) | CFO ($mm) | OpInc ($mm) | Rev YoY | Net YoY |
|---|---|---|---|---|---|---|
| 2025 | 1.9 | 190 | 473 | 290 | +6.7% | -32.3% |
| 2024 | 1.8 | 281 | 502 | 266 | -62.3% | -32.2% |
| 2023 | 4.7 | 415 | 333 | 426 | -33.2% | +12.8% |
| 2022 | 7.0 | 367 | 510 | 574 |
Note: Omitted columns lack sufficient annual XBRL coverage in the provided tags (need ≥2 annual points): Capex. Source: SEC companyfacts cache [F1].
Capital returns and efficiency (annual)
| FY | Div ($mm) | Buybacks ($mm) | FCF ($mm) |
|---|---|---|---|
| 2025 | 108 | 0 | -297 |
| 2024 | 103 | 0 | -21 |
| 2023 | 161 | 5 | -187 |
| 2022 | 177 | 7 | -147 |
Source: SEC companyfacts cache [F1].
Note: Buybacks shown as amount spent; no repurchases occurred in the latest two years post-spin-off.
Capital Structure and Liquidity Position
MDU maintains robust liquidity supported by multiple revolving credit facilities aggregating several hundred million dollars across subsidiaries [S16][S23]. In December 2025, it amended its primary revolving credit agreement extending maturity from May 2028 to December 2030 with an initial commitment amount of $200 million plus letter of credit sublimits [S9][S11]. Interest rates vary with credit rating but presently feature favorable terms (facility fee around 0.175%) reflecting solid investment-grade status.
Additionally, WBI Energy Transmission Inc., an indirect subsidiary focused on pipeline assets within MDU’s portfolio, arranged amendments permitting issuance of up to an additional $350 million senior unsecured notes under a private shelf program through late 2028 [S20][S27]. This underscores a proactive approach toward flexible financing options enabling capital expenditure funding without abrupt liquidity strain.
Dividend Policy and Capital Allocation
Aligned with its regulated utility profile post-spin-off, MDU established a dividend payout target between 60%-70% of regulated energy delivery earnings [S2][S6]. This marked a shift designed to balance shareholder returns with sustainable reinvestment levels in capital projects.
MDU enjoys an extensive legacy of dividend payments spanning over eight decades uninterruptedly enhancing shareholder trust [S2]. In FY2025 it paid out approximately $108 million in dividends representing steady annual growth compared with previous years [F1]. However, share repurchases have been paused following the spin-off period as the company prioritizes balance sheet stability amid significant capital demands [F1][S6].
Industry and Regulatory Context
MDU operates within the highly regulated U.S. utility sector encompassing electricity generation/transmission and natural gas distribution/transportation/storage primarily across northern Plains states [S8]. Regulatory frameworks provide both stable demand visibility and barriers limiting new entrants but also impose cost scrutiny impacting how effectively tariff increases can offset input inflation or supply chain disruptions [S14][S7].
Tariffs enacted recently by the U.S government on imports have inflated raw material pricing pressures while intermittently disrupting supply chains leading to project timing uncertainties [S14][S2]. The company's ability to recover such incremental costs hinges on favorable rulings by state regulators—a risk acknowledged prominently among key uncertainties faced by management [S7].
Tax legislation evolving since the Inflation Reduction Act has curtailed some clean energy credits affecting deferred tax asset recognition though MDU does not anticipate material ongoing tax rate changes at present [S2][S10]. Utility operators often encounter such legislative fluctuations requiring adaptive capital strategies.
Growth Prospects and Challenges Ahead
Post-spin-off growth relies largely on organic expansion within rate-regulated segments including:
- Upgrading electric grid infrastructure for reliability amid increasing renewable integration.
- Expanding natural gas distribution footprint driven by incremental residential/commercial customers along with pipeline transportation services.
- Leveraging operational excellence initiatives under the 'CORE' framework to improve customer service efficiency.
- Benefiting from favorable rate cases that allow timely cost pass-through supporting earnings growth [N1][N2][S2].
However, several factors could constrain upside:
- Tariff-driven input cost surges moderating profit margins if regulators disallow accelerated recovery or retrospective cost inclusions.
- Continued elevated capital spending requirements temporarily pressuring free cash flow unless offset by improved operational metrics or external financing.
- Potential lag or tightening in regulatory approvals slowing project execution affecting near-term operational leverage realization.
- Macroeconomic volatility including interest rates impact borrowing costs altering financing economics especially for long-duration infrastructure projects.
Monitoring Milestones and Indicators
While no explicit forward guidance was provided at latest filing dates beyond qualitative commentary on strategic priorities and risks [N1][S2], key developments warrant close attention:
- Outcomes of upcoming rate cases or jurisdictional hearings impacting allowed returns or cost recovery scopes.
- Quarterly updates highlighting any shifts in tariff impacts or supply chain conditions influencing short-term margins.
- Capex execution progress reports relative to planned modernization schedules.
- Changes in dividend policy or capital allocation reflecting evolving cash generation profiles.
- Credit rating actions impacting borrowing costs associated with revolving facilities or debt issuances.
Conclusion
MDU Resources Group’s deliberate pivot towards becoming a streamlined regulated energy delivery operator post-Everus spin-off clarifies its corporate identity anchored in stable cash flows from utility infrastructure assets [S2][S8]. Despite short-term earnings softness fueled by lingering inflationary pressures and hefty investment levels exerting free cash flow constraints, the firm benefits from entrenched regulatory protections and an established dividend heritage appealing for income-focused investors.
Critical variables shaping near-to-medium term performance include tariff pass-through efficiencies amidst volatile input costs alongside navigation of increased capex burdens inherent in maintaining modernized energy grids serving evolving customer needs. The extension of revolving credit facilities through decade-end preserves financial flexibility critical for balancing investment requirements against return expectations.
From an industry perspective, continued emphasis on clean energy transitions—albeit moderated incentive environments—may influence demand patterns gradually reshaping utility infrastructure priorities over longer horizons.
Disclaimer: This memo presents factual analysis based on publicly disclosed information as of February 20, 2026, without offering investment recommendations or price targets.
Disclaimer: This is research-only, informational analysis and not investment advice. It may include AI-generated interpretation and general industry context. Always verify important details using primary sources.
Comments