
Morgan Stanley’s Record Earnings and Capital Strategy Reflect Growth and Volatility Tradeoffs
Morgan Stanley’s diversified platform and capital maneuvers underpin its latest financial performance amid sector-specific headwinds.
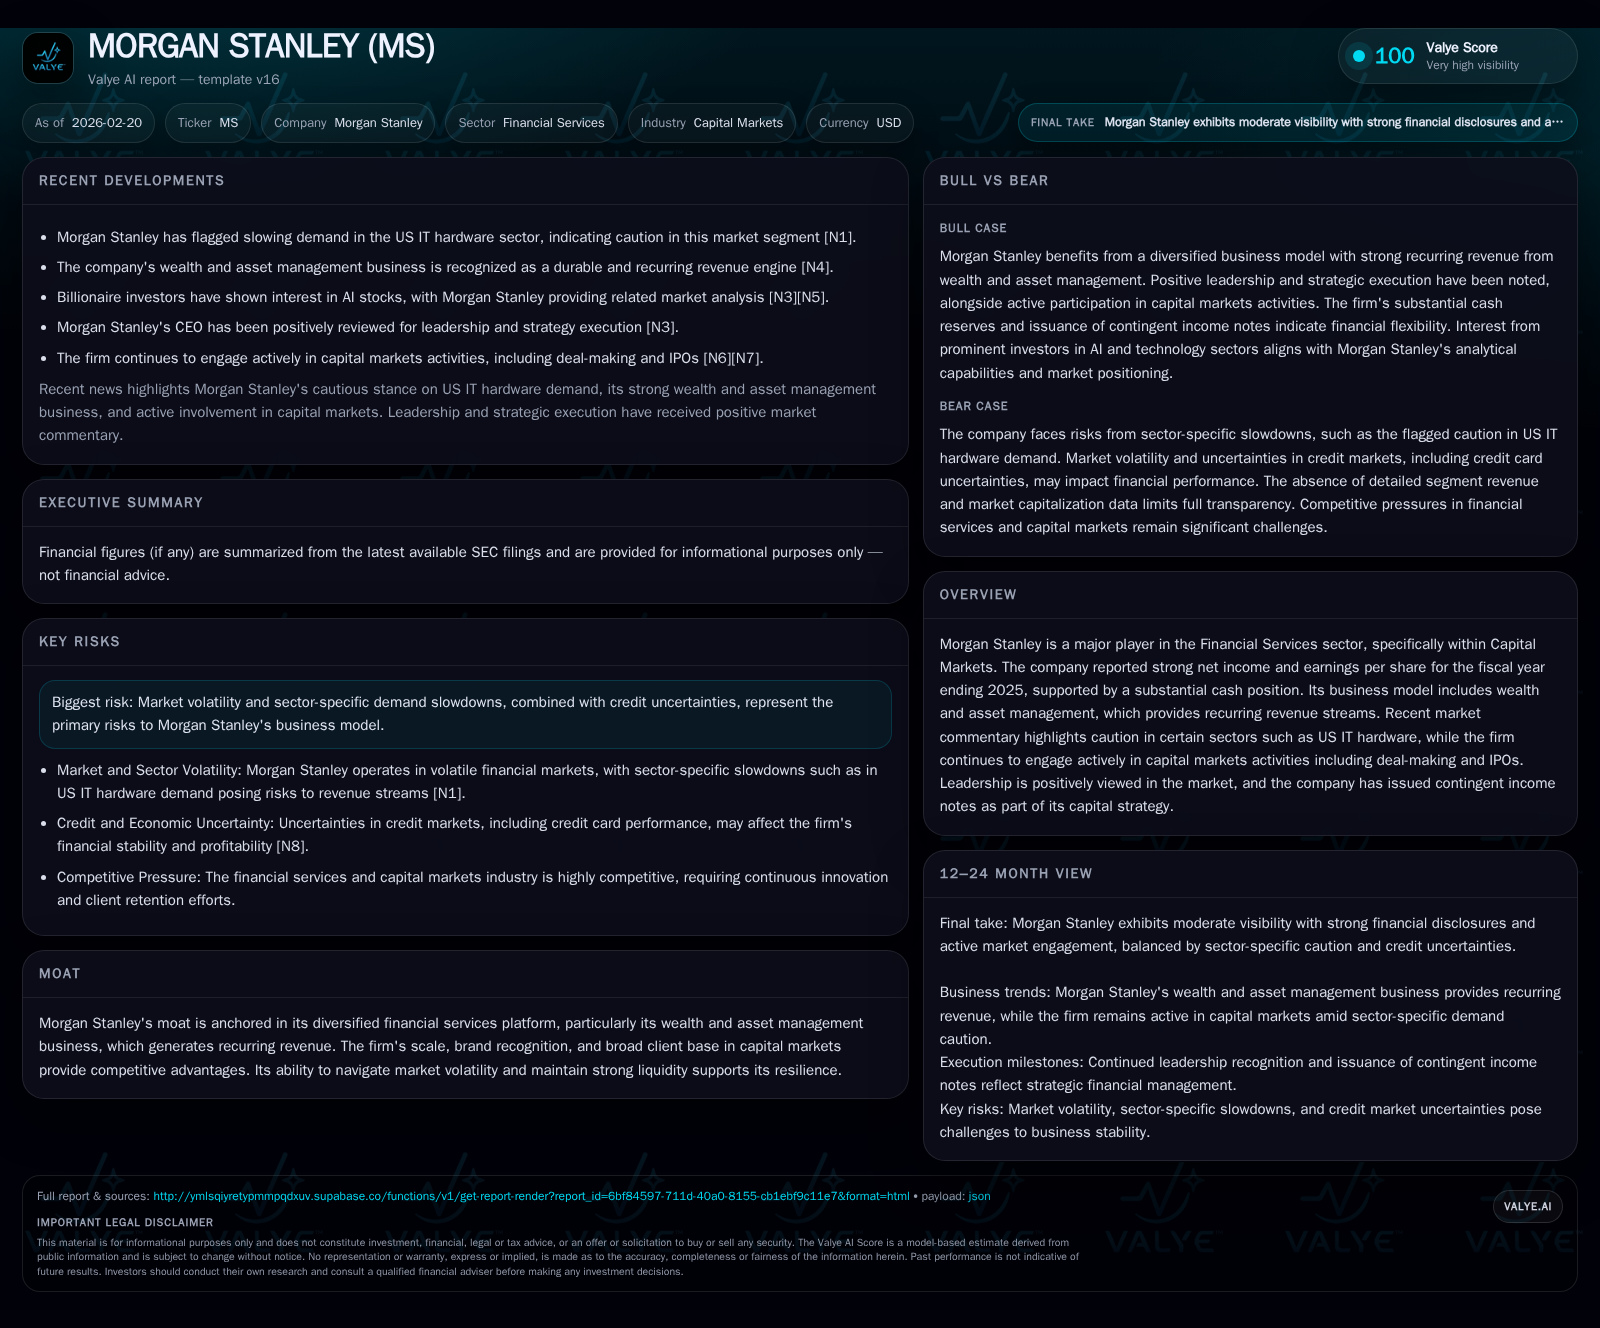
Morgan Stanley (MS) reported record net income of $16.9 billion in fiscal 2025, supported by its wealth and asset management businesses that provide recurring revenue streams. Despite a slight revenue decline, the firm’s strategic capital allocation, including dividend growth and contingent income notes issuance, reflects confidence in future growth amidst market volatility. Key risks include sector-specific demand slowdowns, particularly flagged in US IT hardware, and ongoing macroeconomic credit uncertainties. Monitoring deal-making activity and IPO trends remains crucial for assessing Morgan Stanley’s near-term performance trajectory.
Historical Performance and Financial Drivers
Morgan Stanley closed fiscal year 2025 with robust financial results, marking a net income of approximately $16.9 billion, representing a substantial increase of nearly 26% over the prior year’s $13.4 billion. This improvement came despite total revenues slightly contracting by 0.8%, landing near $97 billion by end-2025 [F1]. The top-line stability belies underlying shifts within business segments and client activity levels.
The firm's historical revenue trajectory shows steady expansion from $5.7 billion in 2011 to peaks exceeding $9.7 billion quarterly (mid-2015), culminating in the robust but slightly down-trending aggregate revenues latest fiscal year [F1]. These figures underscore Morgan Stanley's growth driven largely by increasing scale in wealth management and advisory services.
Notably absent from SEC filings are detailed operating income figures, but net earnings strength suggests margin management efficacy even amid challenging trading conditions. Operating cash flow dynamics have been more volatile; after a positive $1.36 billion CFO in 2024, the company swung to a negative $17.9 billion cash flow figure in 2025, indicative potentially of inventory or receivables build-up and changes in working capital management which investors should monitor carefully [F1].
Shareholders’ equity grew appreciably to roughly $111.6 billion at year-end 2025 from ~$104.5 billion the prior year, supporting an attractive approximate ROE around 15%, reflecting efficient capital utilization given the scale of earnings generated [F1].
Business Segments: Wealth & Asset Management Moat
One defining strength for Morgan Stanley is its wealth and asset management business lines, which generate recurring fees and deliver resilience against capital markets volatility [N1][S1]. This segment has become pivotal as pure investment banking revenues face cyclical swings linked to deal flow variability.
This stable recurring revenue stream fosters a competitive moat anchored not only on client trust and brand but also on predictable cash inflows that support cross-selling opportunities across advisory and trading desks. Market reports emphasize this as a core pillar underpinning the firm's strategic advantage going forward [N4].
Capital Markets Activity and Sector Cautions
Morgan Stanley's prime positioning in capital markets sees it actively engaged in underwriting IPOs, M&A advisory, and debt issuance amid fluctuating macroeconomic environments [N6][N4]. While recent quarters exhibited earnings beats attributed to surge deal-making activity, certain sectors such as US IT hardware have emerged as cautionary tales due to slowing demand highlighted by Morgan Stanley analysts — signaling uneven recovery patterns that could weigh on future underwriting pipelines [N7].
Given the tight link between technology sector health and parts of Morgan Stanley's investment banking order book, traders and investors alike should track sector-specific indicators closely.
Capital Allocation and Liquidity Profile
The firm's capital allocation demonstrates disciplined dividend policy with payouts rising steadily — shareholders received approximately $6.6 billion in dividends during fiscal 2025 compared with about $6.14 billion the previous year [F1]. However, share repurchase activity has not featured prominently recently with limited disclosed buyback volumes within the latest reporting cycles.
Moreover, Morgan Stanley augmented its capitalization by issuing contingent income notes—a form of hybrid security offering flexibility without immediate equity dilution—reflecting proactive balance sheet management amid potential regulatory capital requirements or anticipated market stress scenarios [N4][S3].
Liquidity remains robust with cash equivalents exceeding $111 billion at year-end 2025, ensuring ample coverage for operational demands and strategic investments [F1]. This cash cushion is vital given negative operating cash flows recorded recently.
Risks: Market Volatility and Credit Sensitivities
Wider macroeconomic uncertainties hang over Morgan Stanley's outlook. Market volatility persists globally with uneven recovery patterns across industries posing pressure on trading revenues and risk-weighted assets.
Credit risk is another salient factor embedded within the firm's extensive financing activities; analysis of SEC disclosures highlights considerable holdings across secured financings, derivative contracts carrying level-3 fair value inputs indicating complexity and valuation uncertainty requiring ongoing surveillance .
Additionally, slowing demand noted in specific sectors like US IT hardware represents a direct headwind on deal origination volumes—a leading revenue driver for Morgan Stanley’s investment bank division currently experiencing mixed performance reviews despite strong overall earnings results.
Future Growth Outlook: Catalysts and Monitoring Points
While explicit forward guidance is limited within recent SEC filings, multiple news sources point towards sustained momentum driven by robust deal-making including IPOs which could fuel fee income growth through early-to-mid 2026 [N4][N6]. The ongoing expansion of wealth management offerings combined with increasing digital platform integration suggests further diversification benefits.
Investors should watch for developments around:
- Activity levels in global equity capital markets including IPO pipelines,
- Credit market conditions influencing lending and derivatives portfolios,
- Potential regulatory changes impacting capital adequacy,
- Management commentary on operating cash flow stabilization,
- Trends in dividend policies or changes to share repurchase strategies.
Summary Table: Key Financial Metrics (USD Millions)
Historical performance (annual)
| FY | Net ($bn) | CFO ($bn) | Net YoY |
|---|---|---|---|
| 2025 | 16.9 | -17.9 | +25.9% |
| 2024 | 13.4 | 1.4 | +47.4% |
| 2023 | 9.1 | -33.5 | -17.6% |
| 2022 | 11.0 | -6.4 |
Note: Omitted columns lack sufficient annual XBRL coverage in the provided tags (need ≥2 annual points): Rev, OpInc, Capex, Buybacks, FCF. Source: SEC companyfacts cache [F1].
Capital returns and efficiency (annual)
| FY | Div ($bn) | ROE% |
|---|---|---|
| 2025 | 6.6 | 15.1 |
| 2024 | 6.1 | 12.8 |
| 2023 | 5.8 | 9.2 |
| 2022 | 5.4 | 11.0 |
Source: SEC companyfacts cache [F1].
Note: Revenue data available only for FY2025 explicitly; operating cash flow exhibits significant volatility.
Closing Considerations
Morgan Stanley’s recent record earnings showcase effective navigation through a complex financial environment leveraging its diversified business model emphasizing durable wealth & asset management fees alongside opportunistic capital markets engagement. Nevertheless, sharp swings in operating cash flow coupled with sectoral headwinds mandate cautious observation of liquidity management mechanisms including contingent income notes issuance.
Its considerable equity base buttresses confidence around sustainable returns and dividend growth detected historically; however future performance will tightly hinge upon deal flow resilience amid evolving economic backdrops as well as effective mitigation of credit-related exposures embedded across derivatives or structured finance instruments.
This analysis anticipates further disclosure throughout the upcoming quarters concerning operational cash flows normalization as well as detailed segment profitability that will clarify ongoing cycle adaptations implemented by management.
Disclaimer: This document is intended solely for informational purposes referencing public data sources without producing investment advice or recommendations.
Disclaimer: This is research-only, informational analysis and not investment advice. It may include AI-generated interpretation and general industry context. Always verify important details using primary sources.
Comments