
SOLV Energy’s IPO Proceeds Strengthen Balance Sheet amid Rapid Renewable Expansion
Post-IPO, SOLV Energy reports robust Q2 results backed by debt elimination and strong liquidity, positioning for accelerated renewable growth.
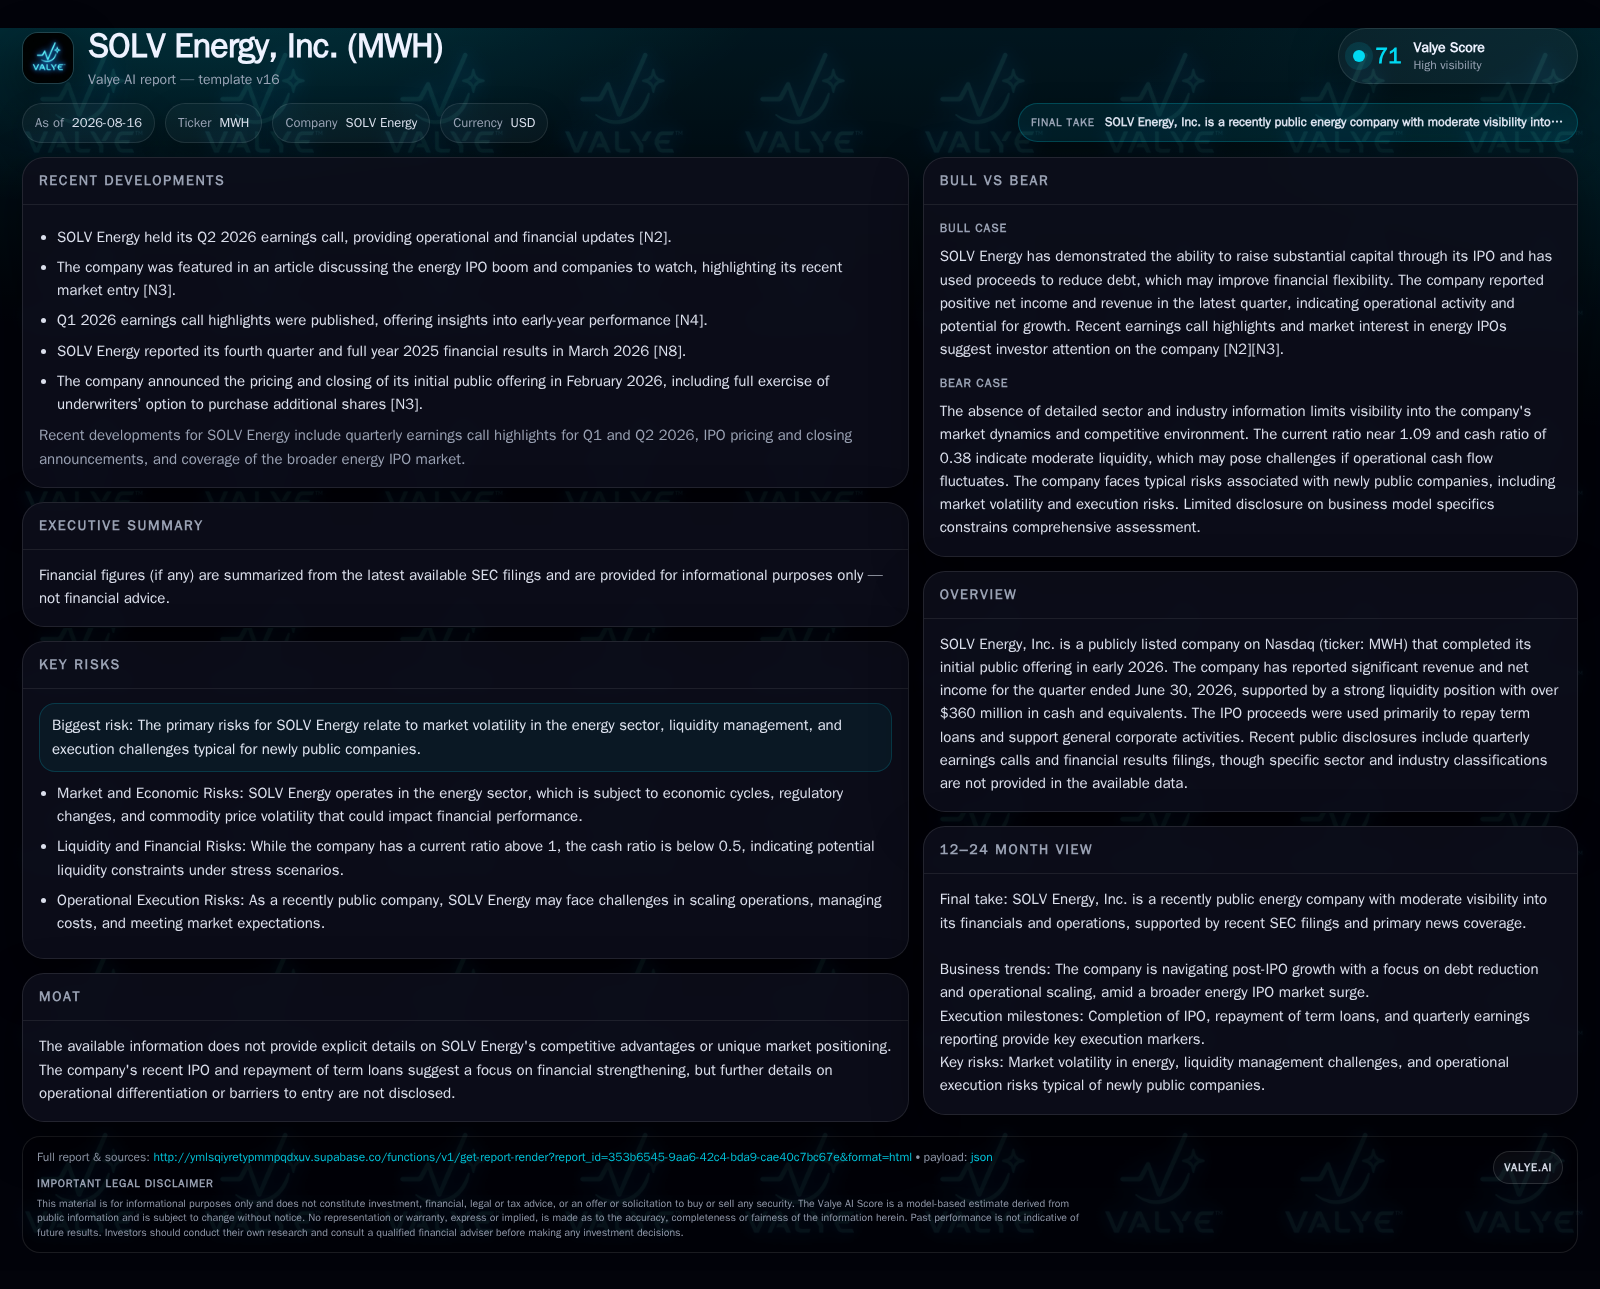
In its Q2 2026 filing, SOLV Energy disclosed $951 million in revenue and $37 million in net income, supported by a significant cash balance exceeding $360 million and no outstanding debt following full repayment of term loans with IPO proceeds. This financial reset reduces refinancing risk and enhances capital flexibility critical in the capital-intensive renewable energy sector. The company’s business model centers on owning renewable assets and selling power under long-term PPAs, providing revenue stability amid sector dynamics focused on capacity utilization and project execution. Ongoing growth depends on successful commissioning of projects, maintaining contracted offtake volumes, and navigating regulatory exposures common to midstream renewable operators.
Q2 Operating Results Illuminate Company Momentum
SOLV Energy’s latest quarterly filing reveals $951 million in revenue with an operating income of nearly $70 million and net income of $37 million for Q2 2026 [F1][S2][S3]. These figures mark a meaningful achievement for a company newly public earlier this year and suggest that its renewable asset portfolio is generating significant cash flow. The fact that SOLV Energy turned a net profit in this phase signals operational leverage inherent in their owned asset base and contracted power sales. Importantly, these results come alongside stable working capital metrics as evidenced by a current ratio slightly above one [F1], indicating short-term financial health during this expansion phase.
Capital Structure Reset Enables Growth Opportunities
Crucially, SOLV Energy deployed approximately $406 million of its $552.5 million IPO net proceeds toward full repayment of outstanding term loans [S2][S5], effectively eliminating interest burdens and refinancing risk. This deleveraging sharply improves financial flexibility enabling the company to deploy capital more strategically across high-return renewable projects without servicing legacy debt traps. Remaining proceeds support general corporate purposes including growth capex — a vital consideration given the capital-intensive nature of building out utility-scale solar photovoltaic (PV) or wind turbine assets. Compared to peers like NextEra Energy or Brookfield Renewable Partners, who manage diverse portfolios with substantial leverage but also scale advantage, SOLV Energy’s clean balance sheet post-IPO contrasts favorably from a liquidity perspective.
Revenue Mechanics Rooted in PPA-Based Power Sales
Renewable Asset Operations: Capacity Factor & Utilization Focus
Operational performance metrics such as installed capacity (measured in MW) and capacity factor (percentage of maximum possible output achieved) critically influence revenue scalability and margin profile [S1]. Higher capacity factors typically reflect superior site selection, technology deployment (e.g., advanced solar PV panels or efficient wind turbines), and favorable resource conditions, translating into higher energy yield (MWh) for sale. Given the thin margin structures often observed across independent power producers (IPPs), optimizing asset utilization is key to enhancing operating income. Delays in grid interconnection or commissioning can impair asset productivity and push back EBITDA generation timelines — risks well known across the sector.
Industry Dynamics Shape Competitive Pressures and Regulatory Exposure
The renewable energy services market is marked by intense competition among project developers, IPPs like Clearway Energy or Pattern Energy, utilities expanding their green portfolios, EPC contractors such as First Solar providing construction expertise, and equipment suppliers driving costs down. Regulatory policies including subsidies, tax credits, tariffs on components like solar panels, and permitting regimes significantly affect project economics. For SOLV Energy and peers alike, changes in subsidy frameworks or delays in approvals can materially impact returns through increased capex or deferred revenues. Compliance with evolving environmental standards also imposes operational constraints affecting timing and cost structure.
Growth Enablers: Project Pipeline, Technology Mix, and Market Demand
Demand-side growth drivers include tightening carbon regulations pushing jurisdictions toward renewables mandates alongside growing corporate sustainability goals increasing appetite for clean power contracts [S1]. Technological advancements lowering cost curves for solar PV modules and wind turbines improve project IRRs enabling faster deployment cycles with reduced financing strain. Integration of energy storage solutions further enhances dispatchability boosting asset value propositions over intermittent generation alone. However, project commissioning timelines represent a critical gating factor; efficient capital deployment depends on timely grid interconnection approval processes and successful operational handover — areas necessitating vigilant management.
Risks Around Execution, Market Prices, and Counterparty Exposure
SOLV Energy faces execution risks typical for new entrants continuing rapid expansion: project delays leading to cost overruns could erode margins while weather-dependent resource variability affects short-term production volumes impacting near-term cash flows [S5]. Moreover, counterparty credit risk embedded within PPAs requires monitoring; defaulting off-takers could force renegotiations often at less favorable terms reducing contracted revenue visibility. Market price volatility for electricity and associated renewable energy certificates (RECs) may influence refinancing deals or future contracted pricing upon renewals although initial PPA terms tend to insulate earnings.
What to Monitor Next: Commissioning Milestones & Contract Updates
Key upcoming indicators include announcements regarding operational start dates of new generating assets which would bolster installed capacity metrics tied closely to revenue ramp-up [S2]. Additionally, any disclosures on expansion or amendment to the PPA portfolio would provide insights into future contracted volume growth crucial for cash flow modeling. Management commentary around capital expenditure pacing post-IPO will also shed light on their strategy execution effectiveness amid tightening regulatory timelines [N1].
Financial Profile Discussion: Cash Strength and Debt-Free Position
As reflected in the June 30 balance sheet snapshot, SOLV Energy holds approximately $364 million in cash equivalents with zero recorded total debt resulting in a negative net debt position — an enviable starting point uncommon among early-stage renewable IPPs [F1]. The current ratio is slightly above one, indicating adequate short-term liquidity relative to liabilities despite large working capital needs typical of this asset-building phase [F1]. The solid operating income generation complemented by positive net earnings elevates confidence levels on sustainable free cash flow development once capital expenditures stabilize.
This analysis synthesizes SEC filings alongside relevant industry context applicable to SOLV Energy's operational trajectory post-IPO through mid-2026. While detailed contract-level data remains private prohibiting granular assessment of pricing or counterparties, the disclosed financials confirm meaningful scale achievement combined with prudent capital structure management typical for emerging renewable IPPs aiming to grow through firm contracted revenues amid sector headwinds around regulation and market dynamics.
Disclaimer: This report is an informational analysis based solely on publicly available data as of August 2026 without offering investment advice or research views.
Disclaimer: This is research-only, informational analysis and not investment advice. It may include AI-generated interpretation and general industry context. Always verify important details using primary sources.

Comments