
Magnachip’s Challenge: Liquidity Strength vs. Persistent Losses in a Shifting Semiconductor Landscape
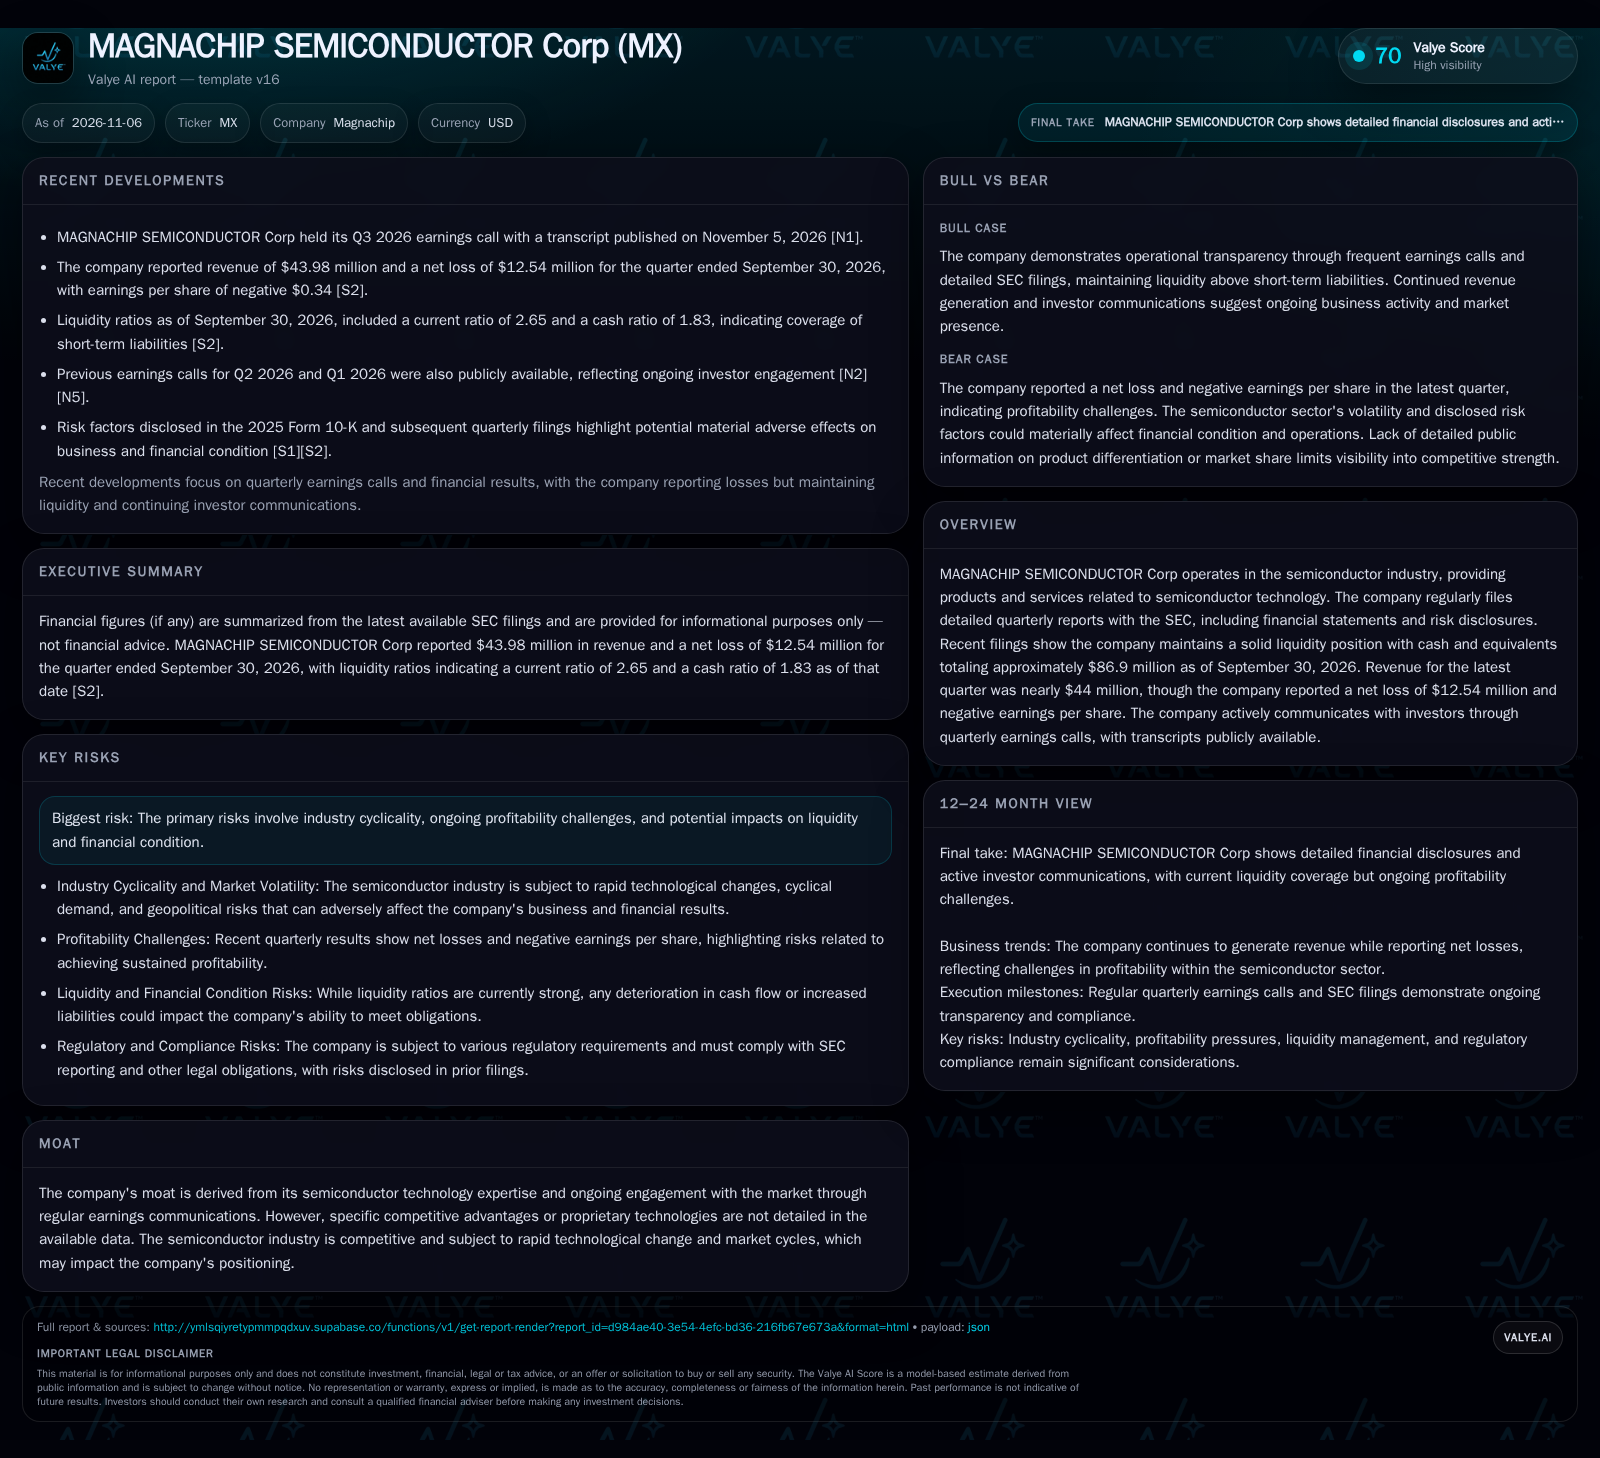
Magnachip reported $43.98 million in Q3 2026 revenue with a net loss of $12.54 million, maintaining a cash balance of $86.9 million and a current ratio of 2.65.
Magnachip reported $43.98 million in Q3 2026 revenue with a net loss of $12.54 million, maintaining a cash balance of $86.9 million and a current ratio of 2.65. While liquidity coverage is strong, ongoing losses underscore the need for operational improvement or strategic repositioning. The company’s continued transparency through regular earnings calls suggests a commitment to investor engagement, but the lack of disclosed product or market leadership leaves its competitive standing uncertain. Monitoring margin trends, cash burn, and any strategic pivots will be critical going forward. [S2] [N1]
Magnachip Semiconductor enters late 2026 with a pronounced split between financial resilience and operational headwinds. The company’s third-quarter results show a reported liquidity position buffer, with $86.9 million in cash and a current ratio well above 2.5. Yet, the core challenge remains: Magnachip posted a net loss of $12.54 million on $43.98 million in revenue, continuing a pattern of negative earnings. In a semiconductor industry defined by fast product cycles, fierce competition, and periodic demand shocks, the question is whether Magnachip’s balance sheet can buy enough time for a turnaround—or if persistent losses will eventually erode its strategic options. [S2] [N1]
Latest Quarter Underscores Liquidity and Loss Dilemma
Magnachip Semiconductor’s Q3 2026 results highlight a classic tension in mid-tier semiconductors: reported liquidity position versus sustained profitability struggles. The company reported cash and liquidity metrics for the period; these figures do not by themselves establish operating runway, investment capacity, financial flexibility, or financing capacity. However, this financial buffer is offset by a quarterly net loss of $12.54 million and negative earnings per share of $0.34 on $43.98 million in revenue. While these numbers confirm Magnachip’s ability to meet immediate obligations, the ongoing losses raise concerns about how long the company can rely on its balance sheet without meaningful operational improvement or a shift in business strategy. [S2]
Revenue Sources and Cost Structure: Where Margins Are Pressured
Magnachip’s core economics are likely shaped by the classic semiconductor model: high upfront R&D and capital expenditures, variable manufacturing costs, and significant exposure to pricing cycles. With quarterly revenue near $44 million but continued net losses, the company’s gross margins are plausibly under pressure from pricing competition, input cost volatility, or underutilized capacity. Fixed costs—such as depreciation, engineering, and administrative expense—may be consuming a disproportionate share of revenue, limiting operating leverage. Unless the company can drive higher volumes, secure premium pricing through differentiated products, or materially reduce costs, profitability will remain elusive. The current liquidity cushion can absorb losses for several quarters, but persistent cash burn would eventually require external financing, asset sales, or a strategic pivot if not reversed.
In addition to the pressures on gross margins, Magnachip’s cost structure likely includes significant fixed components that limit its ability to flex expenses in response to revenue fluctuations. For semiconductor firms, R&D investments are critical yet often inflexible in the short term, as innovation cycles require sustained funding to maintain competitiveness. Similarly, capital expenditures on manufacturing equipment and facilities represent sunk costs that do not scale down easily during downturns. If Magnachip’s current revenue base fails to fully absorb these fixed costs, operating leverage remains negative, exacerbating losses. A strategic focus on improving capacity utilization or shifting toward higher-margin product lines could help mitigate these structural cost challenges.
Moreover, supply chain dynamics in semiconductors can materially affect cost structures. Volatility in raw material prices, such as silicon wafers or specialty chemicals, can compress margins if not offset by pricing power or hedging strategies. Additionally, manufacturing yield rates and quality control impact effective cost per unit; suboptimal yields increase per-unit costs and reduce profitability. If Magnachip’s manufacturing processes are not optimized or if it lacks scale to negotiate favorable supply contracts, cost disadvantages may persist. Continuous process improvements and strategic supplier relationships would be necessary to enhance cost competitiveness over time.
Market Positioning: Navigating a Crowded and Cyclical Field
The semiconductor industry is intensely competitive, with global players spanning foundries, fabless design houses, and integrated device manufacturers. Magnachip’s filings do not disclose specific product categories, market share, or proprietary technology advantages, making its precise competitive stance difficult to assess. In this environment, companies with differentiated IP, scale-driven cost advantages, or deep customer relationships can capture outsized margins and weather downturns. Conversely, firms lacking clear technological or market leadership risk margin compression as they compete largely on price or legacy contracts. Without evidence of a defensible niche or high switching costs, Magnachip may be vulnerable to both larger rivals and upstart disruptors, particularly as industry cycles turn.
Turnaround Potential: What Would Signal a Path to Sustainable Profitability?
A credible Magnachip turnaround would likely require either a material improvement in gross margins or a reduction in fixed overhead, possibly tied to a successful product launch or cost rationalization. Upside could materialize if the company introduces a differentiated chip solution that commands premium pricing or secures a design win with a major customer, driving higher utilization of existing manufacturing assets. Alternatively, a strategic restructuring—such as divesting non-core assets or outsourcing fabrication—could improve cost structure. Evidence supporting this scenario would include a sequential improvement in gross and operating margins, reduced quarterly losses, and management commentary on new customer contracts, technology wins, or structural cost savings. Conversely, if losses persist and no new product or customer traction is disclosed, this scenario would be falsified.
Continued Losses with Liquidity Buffer: Most Likely Trajectory Absent Change
The most plausible near-term scenario is that Magnachip continues to generate moderate revenue while running operating losses, gradually drawing down its cash reserves. With no public evidence of a competitive breakthrough or margin expansion, the company’s liquidity cushion provides a temporary shield but does not address underlying economic challenges. Confirmation would come from further quarters with similar revenue and loss patterns, stable but slowly declining cash balances, and limited disclosures of new customer wins or product launches. A break from this pattern would require clear signals—such as improved profitability metrics, new strategic partnerships, or cost-cutting initiatives—none of which are currently evident in filings or earnings calls.
Cash Burn Accelerates: When Liquidity No Longer Suffices
This could be triggered by a sector downturn, loss of major customers, or inability to keep pace with technological shifts, forcing the company to fund operations through external capital or asset sales. If quarterly net losses increase or revenue declines, the margin of safety provided by the current ratio and cash balance would shrink quickly. Signs of distress could include a sharp drop in cash balances, disclosures of covenant breaches, layoffs, or seeking emergency financing. If disclosed, an unsustainable cash burn rate—where projected losses outpace the ability to raise or conserve cash—would confirm a downside scenario.
Testing Magnachip’s Thesis: What Needs to Change or Hold Steady
Sequential quarterly changes in gross margin, if disclosed, would help determine whether cost structure or pricing power is improving.
Trends in cash and cash equivalents—especially the rate of quarterly cash burn—will be critical for assessing runway.
Any disclosure of new customer wins, design contracts, or product launches would indicate traction beyond legacy revenue streams.
Management guidance or commentary on cost-cutting, restructuring, or strategic pivots would signal proactive adaptation.
Evidence of improved operating leverage—such as declining SG&A or R&D expense as a percentage of revenue—would support a turnaround thesis.
Sector demand indicators, such as end-market recovery or supply chain normalization, could impact revenue stability.
Updates on risk disclosures in SEC filings may reveal emerging or receding threats to liquidity and operations.
Disclaimer: This is research-only, informational analysis and not investment advice. It may include AI-generated interpretation and general industry context. Always verify important details using primary sources.

Comments