
MaxLinear Strengthens Liquidity and Credit Terms as Q1 2026 Earnings Surpass Expectations
MaxLinear’s recent credit facility amendment paired with an earnings beat highlights improved financial flexibility amid ongoing profitability challenges.
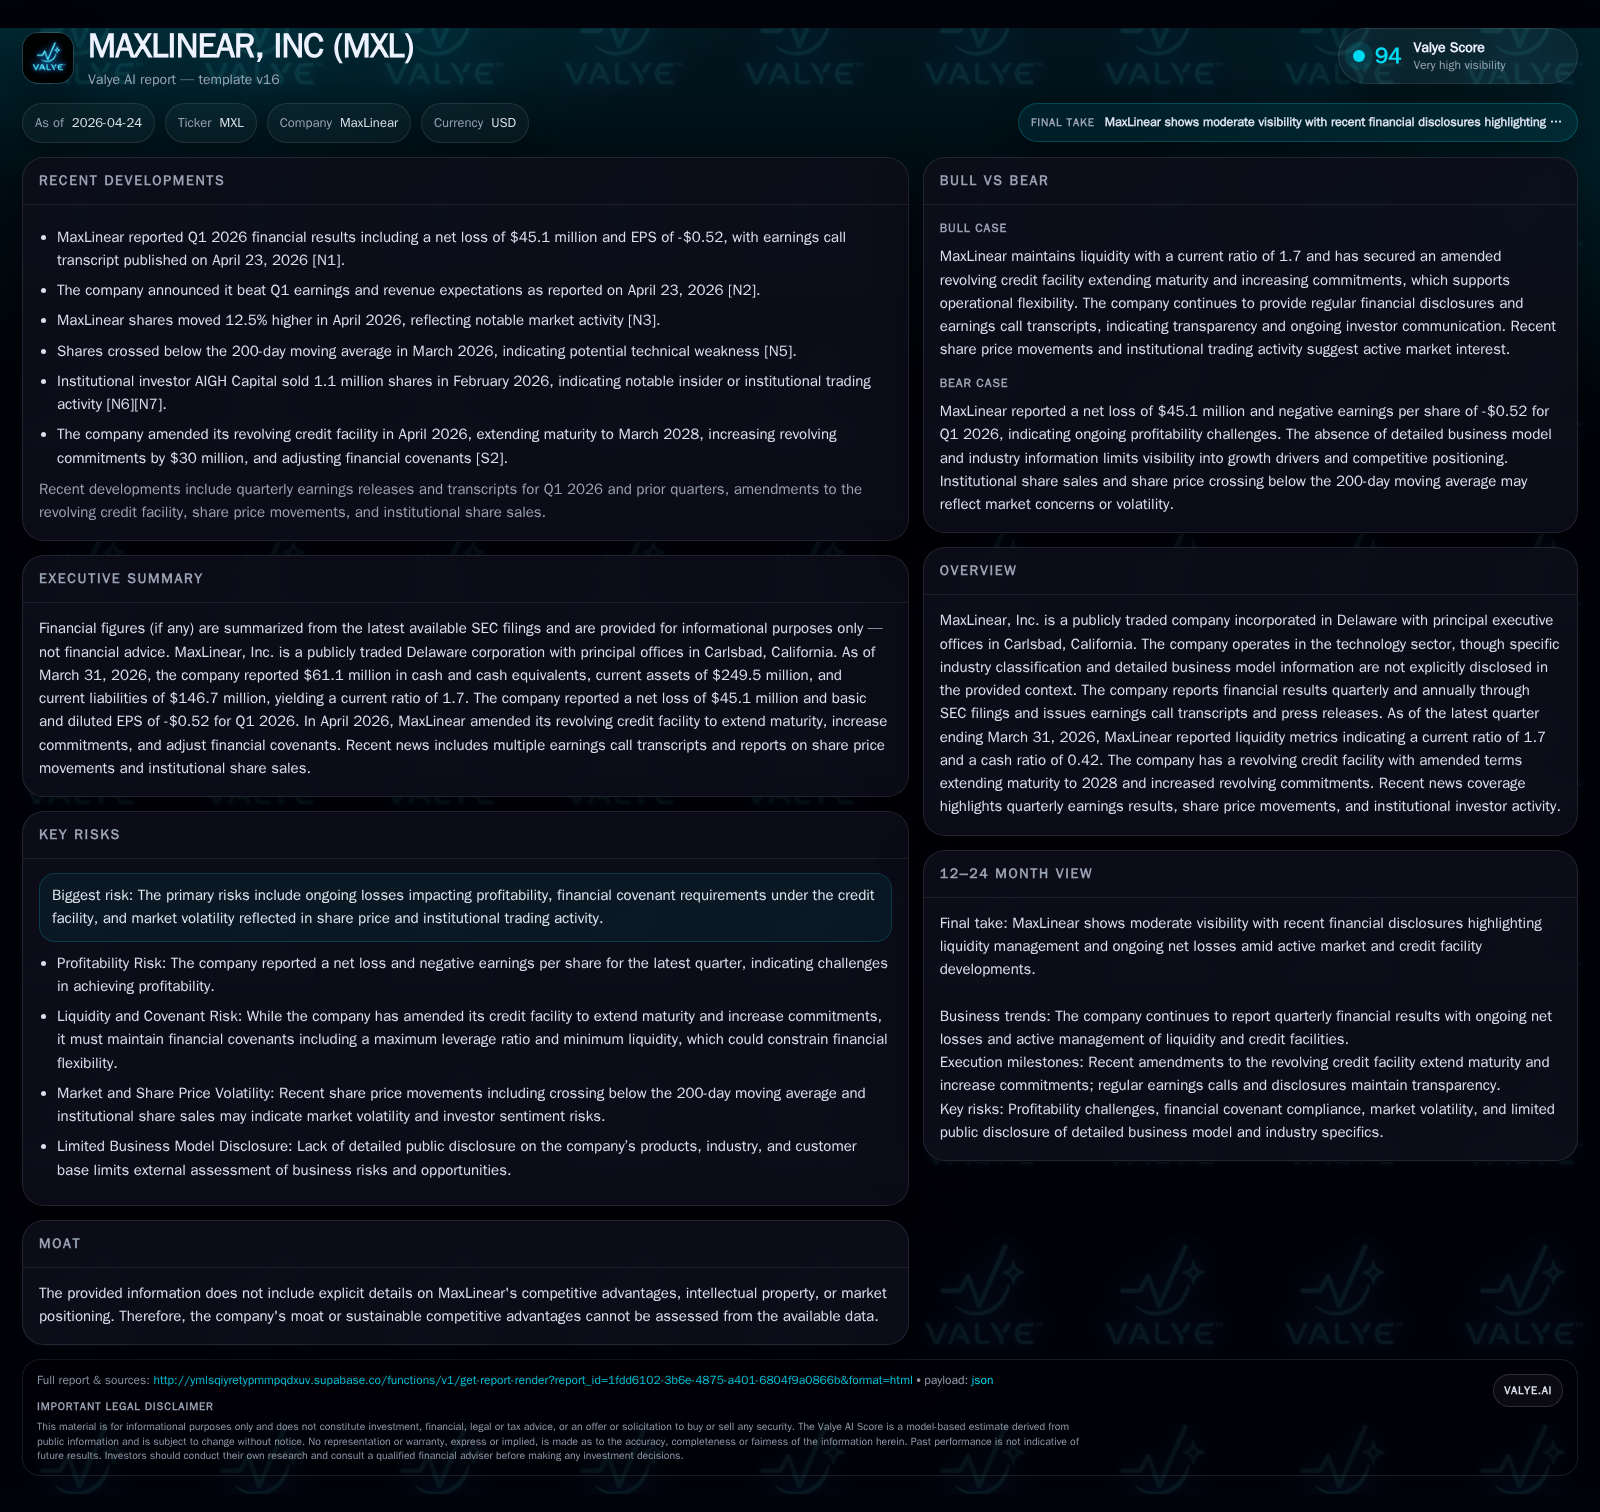
In Q1 2026, MaxLinear amended its credit agreement to extend debt maturities and expand revolving credit by $30 million while posting better-than-expected earnings results. The undrawn revolver and strengthened liquidity ratios support the company’s operational needs despite lingering net losses at the annual level. MaxLinear operates in the analog/mixed-signal semiconductor space targeting communications markets, facing competitive pressures and supply chain dynamics that influence pricing and capacity. Growth opportunities exist alongside margin headwinds, with watch points on covenant compliance and execution momentum.
Latest Quarterly Operating Update: Earnings Beat and Credit Facility Amendments MaxLinear reported its Q1 2026 financial results in the 10-Q filed April 23, 2026 [S2], showcasing an earnings performance that exceeded consensus expectations per earnings call transcripts [N1][N2]. Crucially, concurrent with this reporting was a material definitive event releasing an amendment to the existing credit agreement dated June 2021, executed April 22, 2026 [S3]. This Second Amendment extends the maturity date of MaxLinear’s senior secured revolving credit facility from June 23, 2026 to March 23, 2028. It further increases the available revolving commitments by $30 million—enhancing the company’s liquidity runway amid ongoing market uncertainty—and adjusts applicable interest margins upward to 2.25% for SOFR loans and 1.25% for base rate loans. Notably, the revolver was undrawn as of the amendment's effective date providing immediate access to incremental liquidity without additional leverage on the balance sheet [S3]. This strategic move appears designed to reinforce operational flexibility while managing debt service obligations prudently. Despite persistent annual net losses reported over recent years—including a $136.7 million loss in FY2025—the more recent quarterly results imply some moderated financial pressure as demonstrated by positive underlying cash flow generation trends for operating activities [F1]. This dichotomy underscores MaxLinear’s path through transitional profitability challenges while bolstering near-term solvency. ## MaxLinear Business Model Overview: Customer Solutions and Market Positioning According to MaxLinear’s latest annual disclosure from January 29, 2026 [S1], the company principally develops analog and mixed-signal semiconductor components optimized for varied communications applications such as broadband infrastructure, network equipment, data centers, and wireless connectivity devices. Revenue generation is concentrated on supplying integrated circuits that enable enhanced signal processing performance at competitive power consumption levels—a crucial technical specification set for carriers and OEM partners seeking bandwidth improvements without proportional energy cost rises. MaxLinear gains commercial traction mainly through winning design opportunities early in device OEM development cycles—a process often characterized by high switching costs due to embedded firmware compatibility requirements and extended qualification timelines. The company’s ability to secure ongoing design wins underpins its revenue visibility but heightens exposure to customer adoption latency inherent in semiconductor product lifecycles. However, margins are pressured by a combination of factors including technological complexity necessitating continuous R&D investment, industry-wide component pricing fluctuations dictated by supply-demand imbalances, plus customer mix variability across geographic regions.[S1] ## Industry Dynamics: Competition, Pricing Power, and Supply Constraints MaxLinear competes within a fragmented semiconductor analogue niche crowded with established players that wield differing strategic advantages ranging from scale economies to specialized IP portfolios [S1]. Competitive intensity is marked by cyclical pricing pressures driven by periodic oversupply phases in wafer fabrication capacity alongside acute bottlenecks when leading foundries face surge demand. Recent market commentary highlights that pricing elasticity is moderated by moderate switching costs for customers once contracts expire or when next-generation technology adoption accelerates [N3][N4]. Simultaneously, supply chain constraints—exacerbated during global chip shortages—limit production volume expansions constraining near-term growth potential. Regulatory frameworks relevant mainly pertain to international trade controls impacting supply sourcing decisions rather than direct product compliance barriers.[S4] ## Growth Prospects: Demand Drivers and Potential Headwinds Core growth drivers include secular expansion of data consumption globally pushing network infrastructure upgrades where MaxLinear components integrate. Additionally, technological transition waves toward next-gen broadband standards—like evolving Wi-Fi protocols or fiber-optic enhancements—increase component complexity favoring vendors offering multifunctional chipsets. Conversely, longer sales cycles influenced by macroeconomic uncertainty slow down end-market deployment timelines potentially delaying revenue ramp-ups. The structural shift towards diversified product mix could mitigate single-market dependence but risks diluting gross margin if lower-margin segments grow faster.[S1][N1] Management commentary further references cautious optimism around operational efficiencies gained from prior restructuring actions contrasted against lingering headwinds affecting full profitability recovery.[N1] ## Capital Structure Evolution and Liquidity Profile MaxLinear’s capital structure evolved positively post Second Amendment whereby revolving credit accessibility increased by $30 million with maturity pushed out by nearly two years providing significant additional runway for capital deployment or balance sheet buffer [S3]. Current liquidity metrics as of March 31, 2026 include a current ratio of approximately 1.7 supported by $61 million in cash equivalents versus $147 million in current liabilities according to quarterly filing disclosures [F1][S2]. Net debt stood near $63.9 million using most recently available year-end total debt of $125 million less cash balances [F1]. The incrementally higher borrowing margins are consistent with observed credit market conditions reflecting risk adjustments but remain within manageable cost brackets. These factors collectively will provide indications on execution consistency amid prevailing sector volatility. ## Supporting Financial Summary Table ### Historical performance (annual) | FY | Net ($mm) | CFO ($mm) | OpInc ($mm) | Capex ($mm) | Net YoY |
| --- | :---: | :---: | :---: | :---: | :---: | | 2025 | -137 | 20 | -127 | 13 | +44.3% | | 2024 | -245 | -45 | -223 | 18 | -235.2% | | 2023 | -73 | 43 | -38 | 13 | -158.5% |
| 2022 | 125 | 389 | 180 | 41 | | Source: SEC companyfacts cache [F1]. ### Capital returns and efficiency (annual) | FY | Buybacks ($mm) | FCF ($mm) | ROE% | | --- | :---: | :---: | :---: | | 2025 | 20 | 7 | -30.2 | | 2024 | 0 | -63 | -47.5 | | 2023 | 0 | 30 | -10.7 | | 2022 | 32 | 347 | 18.5 | Source: SEC companyfacts cache [F1]. | *Annual figures from latest available data; quarterly figures denote most recent position per filings. ## Disclaimer This analysis is intended for informational purposes only based on publicly available SEC filings and market sources as cited. It does not constitute investment advice or recommendations regarding securities or assets discussed herein.
Disclaimer: This is research-only, informational analysis and not investment advice. It may include AI-generated interpretation and general industry context. Always verify important details using primary sources.
Comments