
NIKE Faces Regional Headwinds and Margin Pressure While Progressing Strategic Reset
Fiscal 2026 saw NIKE Inc. grapple with tariff-driven gross margin contraction and uneven regional sales amid ongoing brand and marketplace realignment.
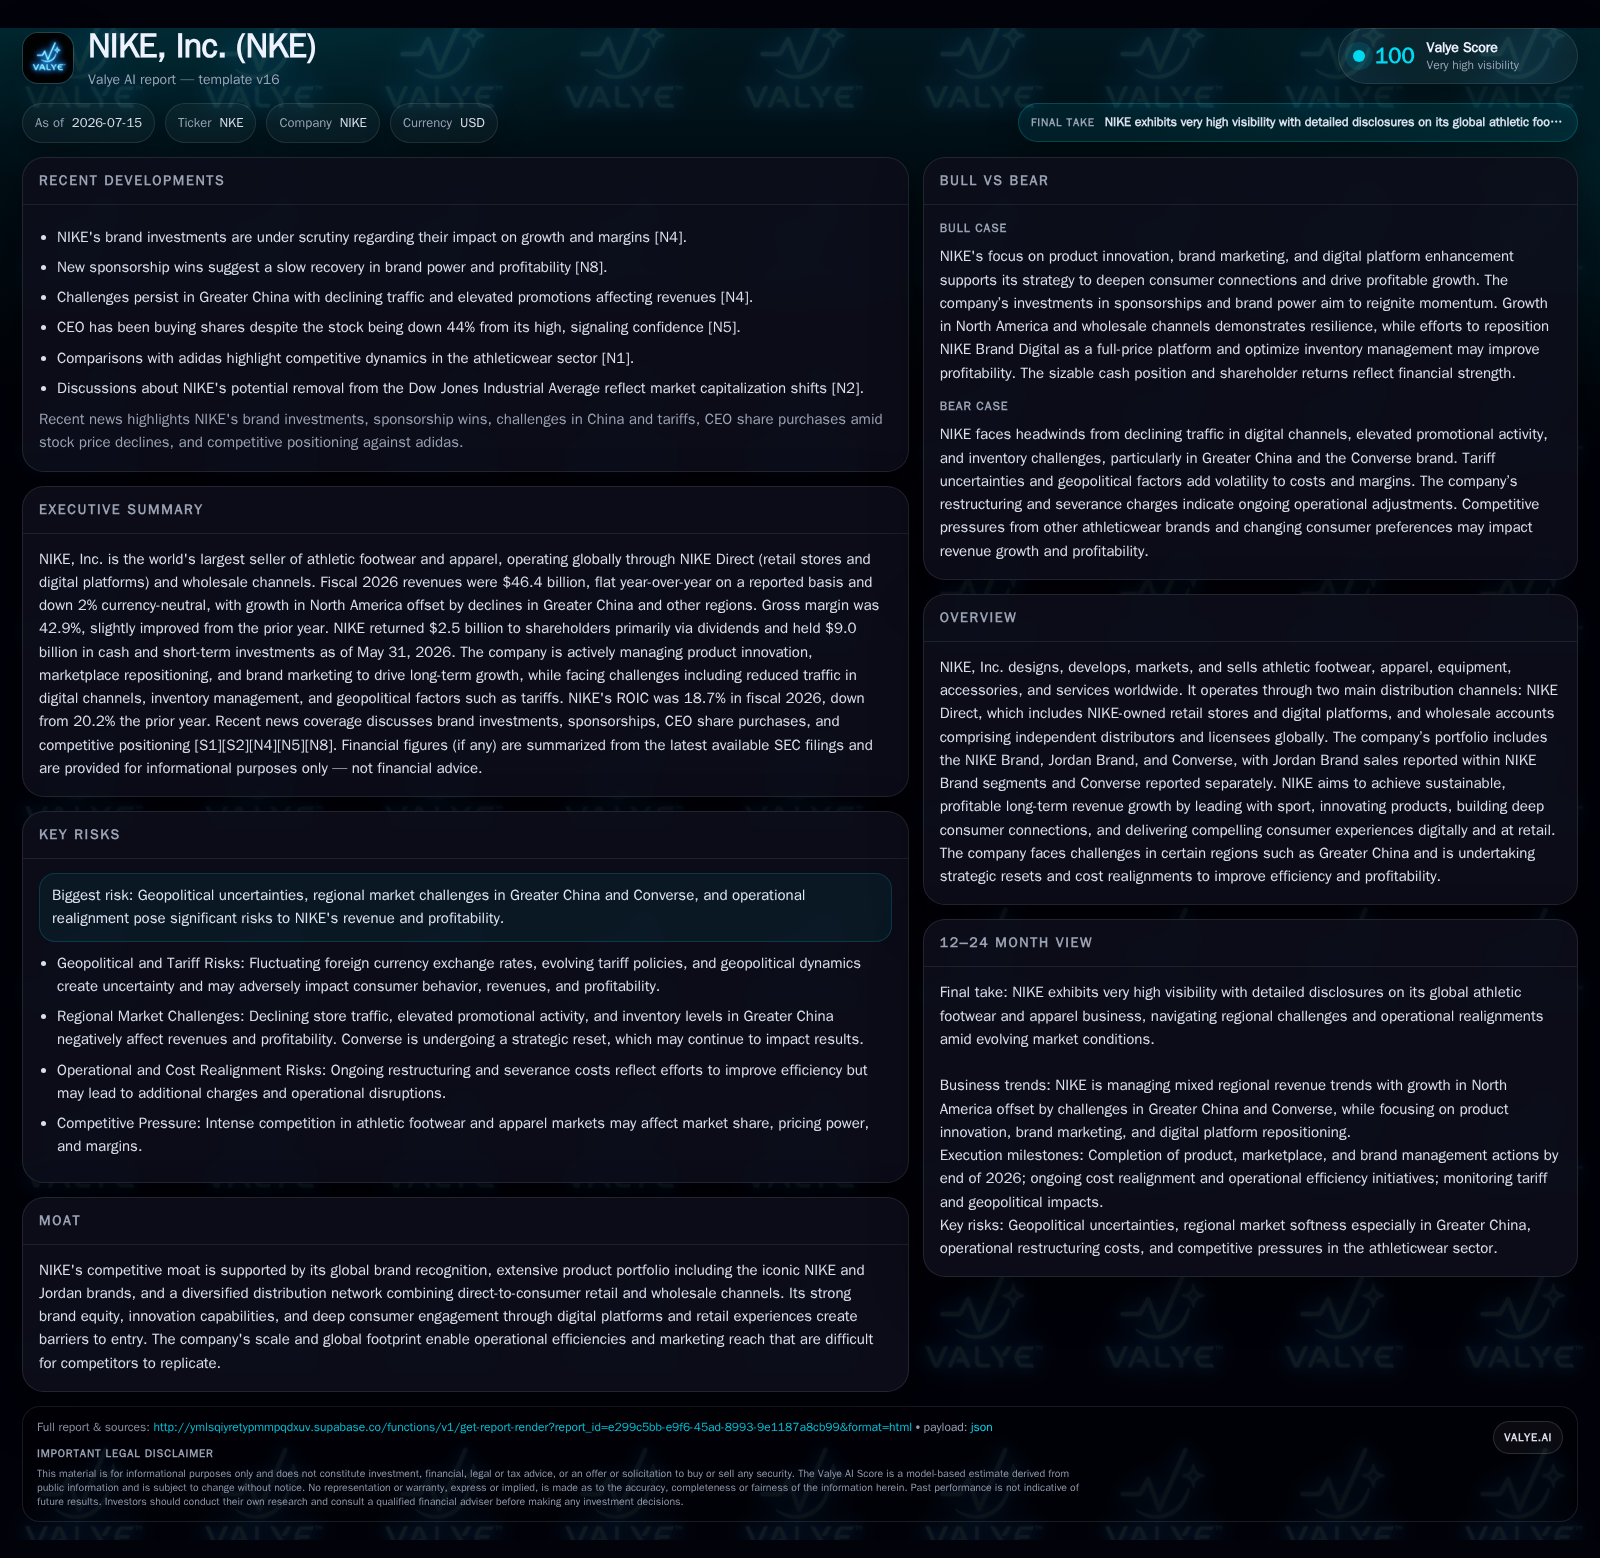
In its latest fiscal quarter ending February 28, 2026, NIKE reported flat revenue on a reported basis but a 3% currency-neutral decline, largely driven by weakness in Greater China and Converse as these segments undergo strategic resets. Gross margins compressed by 130 basis points due mainly to higher product costs from tariffs in North America. The company is actively reducing inventory levels through increased markdowns and elevating demand creation spend to foster long-term growth despite near-term profit pressures. North America leads progress on efficiency initiatives, while Greater China and Converse remain challenged, expected to continue through fiscal 2027. NIKE’s strong brand equity and diversified distribution model underpin a durable moat amid these headwinds.
Recent Operating Update Highlights
NIKE's third quarter of fiscal 2026 (ended February 28) reflected a complex operating environment with $11.3 billion in revenues flat compared to the prior year on a reported basis but showing a currency-neutral decline of approximately 3% [S2]. This nuanced top-line performance masks divergent regional trends: wholesale revenues rose by roughly $0.3 billion driven by growth in North America and Asia Pacific & Latin America (APLA), whereas Greater China and Europe/Middle East/Africa (EMEA) recorded declines [S2]. Direct-to-consumer (DTC) revenues underperformed at $4.5 billion versus $4.7 billion year over year, primarily owing to decreased traffic impacting both physical stores and digital platforms [S2].
Gross margin contracted noticeably by 130 basis points to 40.2%, mainly pressured by higher NIKE Brand product costs linked to U.S. tariffs affecting North American imports—estimated at around a 270-basis-point drag on the gross margin line [S2]. The recovery of previously paid IEEPA tariffs mitigated part of this cost increase by nearly $1 billion in fiscal Q4 but timing differences precluded offsetting this fully during Q3 [S1].
Inventory remained stable at $7.5 billion as of February end compared with May prior year, reflecting unit increases offset by product mix shifts signaling active inventory management amid fluctuating consumer demand dynamics [S2]
Business Model Specifics
NIKE operates through two primary channels: NIKE Direct encompassing owned retail stores and digital commerce platforms, alongside wholesale distribution via independent global partners including licensees [S1][S2]. This dual-channel strategy affords both direct consumer engagement enabling full-price sales capture and broader market reach through wholesale accounts adapting localized assortment strategies.
Revenue generation hinges on designing athletic footwear, apparel, accessories, and equipment bearing strong brand equity notably through the NIKE Brand portfolio which includes Jordan (reported within NIKE Brand segments) and separate Converse operations offering broader lifestyle appeal [S1]. Monetization flows from unit volume sold multiplied by average selling price (ASP), which is sensitive to product mix changes (e.g., high-margin innovation lines versus commodity basics) and promotional activities affecting realized price.
Margins are influenced critically by input costs shaped by tariffs/trade policies—particularly salient given recent elevated U.S. import tariffs—and supply chain cost realignment efforts that aim to optimize warehousing/logistics expenses and channel mix effects favoring DTC gains that typically yield higher margins than wholesale [S1][S2]. Merlin Kumar Commentary highlights the importance of merchandising strategies such as inventory liquidations via markdowns that temporarily pressure margins but clear space for new innovations driving long-term top-line expansion.
Brand marketing spend underpins demand creation via athlete endorsements, sports event sponsorships, and digital consumer engagement initiatives designed to cultivate emotional connections fueling loyalty beyond transactional relationships [S1]. These investments ramp up before major product launches or sports moments capitalizing on heightened consumer attention.
Industry Structure & Competitive Position
Within the athletic apparel and footwear retail industry—a segment defined by intense competition among global brand leaders such as Adidas, Under Armour, Puma, Lululemon, and VF Corporation—NIKE stands out for its scale (> $46 billion annual revenue), broad geographical footprint spanning mature markets like North America and emerging regions including China/APLA, plus an integrated multi-brand portfolio delivering multi-category coverage from performance running shoes to fashion-forward streetwear
Key barriers include entrenched brand equity leveraging extensive investment in proprietary technologies (e.g., Flyknit materials), premium athlete endorsement contracts valued at $15.5 billion obligations annually supporting marketing moat durability, and expansive retail footprint combining digital commerce leadership with physical store presence driving omni-channel personalization and fulfillment advantages [S1][S10]. This integrated ecosystem also enables nimble inventory management crucial against shifting sports lifestyle trends.
Despite this positioning, NIKE faces cyclical challenges typical of discretionary consumer goods sectors: fluctuating fashion trends requiring rapid innovation cycles; exposure to geopolitical risks affecting tariff regimes; susceptibility to economic downturns influencing discretionary spending; plus accelerated cost inflation across supply chains prompting operational resets [S8].
Growth Drivers
Long-term growth prospects depend on accelerating product innovation exemplified by new footwear technologies catalyzing premium ASP retention or growth; expanding direct-to-consumer digital sales which offer richer data-driven engagement capabilities supporting personalized marketing; reinvigorating key markets like Greater China post-pandemic lockdown disruptions through tailored marketplace strategies; mounting brand marketing aligned with prominent sports events enhancing emotional resonance; geographic expansion penetrating emerging economies; sustainability initiatives attracting environmentally conscious consumers; plus leveraging an omnichannel approach that fuses seamless online-offline shopping experiences underscoring customer retention [S1]
Recent progress toward these goals includes redeploying NIKE Brand Digital as a strict full-price platform aimed at enhancing ASPs over discount-driven sales while reinforcing wholesale alliances creating distribution breadth supportive of scale economies [S1][S2]. Product portfolio rebalancing reduces overhang categories to spotlight high-demand segments fueled by stronger differentiation through innovation cycles accelerating replenishment rates at retail partners
Risks & Constraints
Persisting headwinds include protracted softness in Greater China marked by shrinking store traffic, elevated discounting reducing gross margins, and excessive inventory burdens dampening profitability—a scenario expected to unfold through fiscal year ending May 2027 [S1][S2]. Converse’s ongoing strategic reset similarly depresses near-term financial results amid attempts to reposition brand identity aligned with contemporary consumer preferences.
Tariff uncertainties remain material given evolving U.S. trade policies which materially raise input cost bases especially for North American operations where higher duties trimmed gross margins by nearly three percentage points recently. Currency volatility arising from exchange rate fluctuations further complicates revenue comparability internationally impacting localized pricing decisions [S1]
Execution risks around cost realignment involve potential future severance charges (noted $385 million recorded in FY26), logistical transitions creating temporary inefficiencies in fulfillment speed or service levels impairing customer satisfaction levels vital in competitive direct-to-consumer contexts [S1]. Brand investment efficiency is another watchpoint where aggressive spending may not yield commensurate sales lift if consumer demand momentum lags sports calendar expectations or marketing saturation effects arise.
What to Watch Next
Monitoring will focus on quarterly comparable store sales metrics globally outside Greater China to gauge organic consumer strength post-reset actions; progression milestones on Converse revitalization evidencing return to positive revenue trajectory; gross margin trend reversals as tariff impacts normalize or supply chain efficiencies accelerate; digital penetration growth rates revealing success of full-price repositioning of owned platforms; inventory turnover improvements tracking liquidation effectiveness without excessive margin erosion; plus updates on endorsement contract renewals reflecting sustained athlete partnership strategy execution [S26][N12][N13]
Investors will also track capital allocation changes such as recommencement of share repurchases once operating cash flow stabilizes following pause during early FY2026 quarters reflecting cautious liquidity stewardship amid volatile backdrop [S16][F1]. The company’s balance sheet shows substantial current assets of $24.6 billion relative to current liabilities of $12.5 billion, yielding a current ratio of approximately 1.96x, supportive of short-term liquidity needs [F1].
Operating cash flow generation softened relative to prior years ($2.87 billion vs $3.70 billion FY25), consistent with tightened profit margins from cost inflation factors offset somewhat by steady revenue base sustaining overall earnings power albeit below peak levels ($3.11 billion net income FY26 vs $3.22 billion prior) [S1][F1]. Return on invested capital remains healthy at nearly 19%, signaling efficient capital deployment despite near-term earnings headwinds from tactical marketplace adjustments that weigh transiently on profitability metrics [S12]. Dividend distributions totaling approximately $609 million during Q3 align with balanced shareholder return policy preserving financial flexibility while enabling reinvestment priorities including innovation capex tied mostly to R&D rather than heavy fixed asset outlays typical for retail peers with large physical footprints.
Overall balance sheet solidity coupled with disciplined capital spending forms foundation underpinning strategic actions designed for long-term value creation even amidst cyclical pressures highlighted this reporting cycle.
This analysis consolidates information publicly filed with U.S. SEC regulatory authorities combined with established industry understanding relevant for valuation professionals assessing enterprise quality amid current sector dynamics affecting large athletic footwear/apparel companies like NIKE Inc. It is intended solely for informational purposes without constituting investment advice or research views.
Disclaimer: This is research-only, informational analysis and not investment advice. It may include AI-generated interpretation and general industry context. Always verify important details using primary sources.

Comments