
NOV Inc. Manages Backlog and Technology Leadership Amid Oil Market Volatility
Strong backlog and ongoing tech investments underpin NOV’s position while supply chain and contract risks persist.
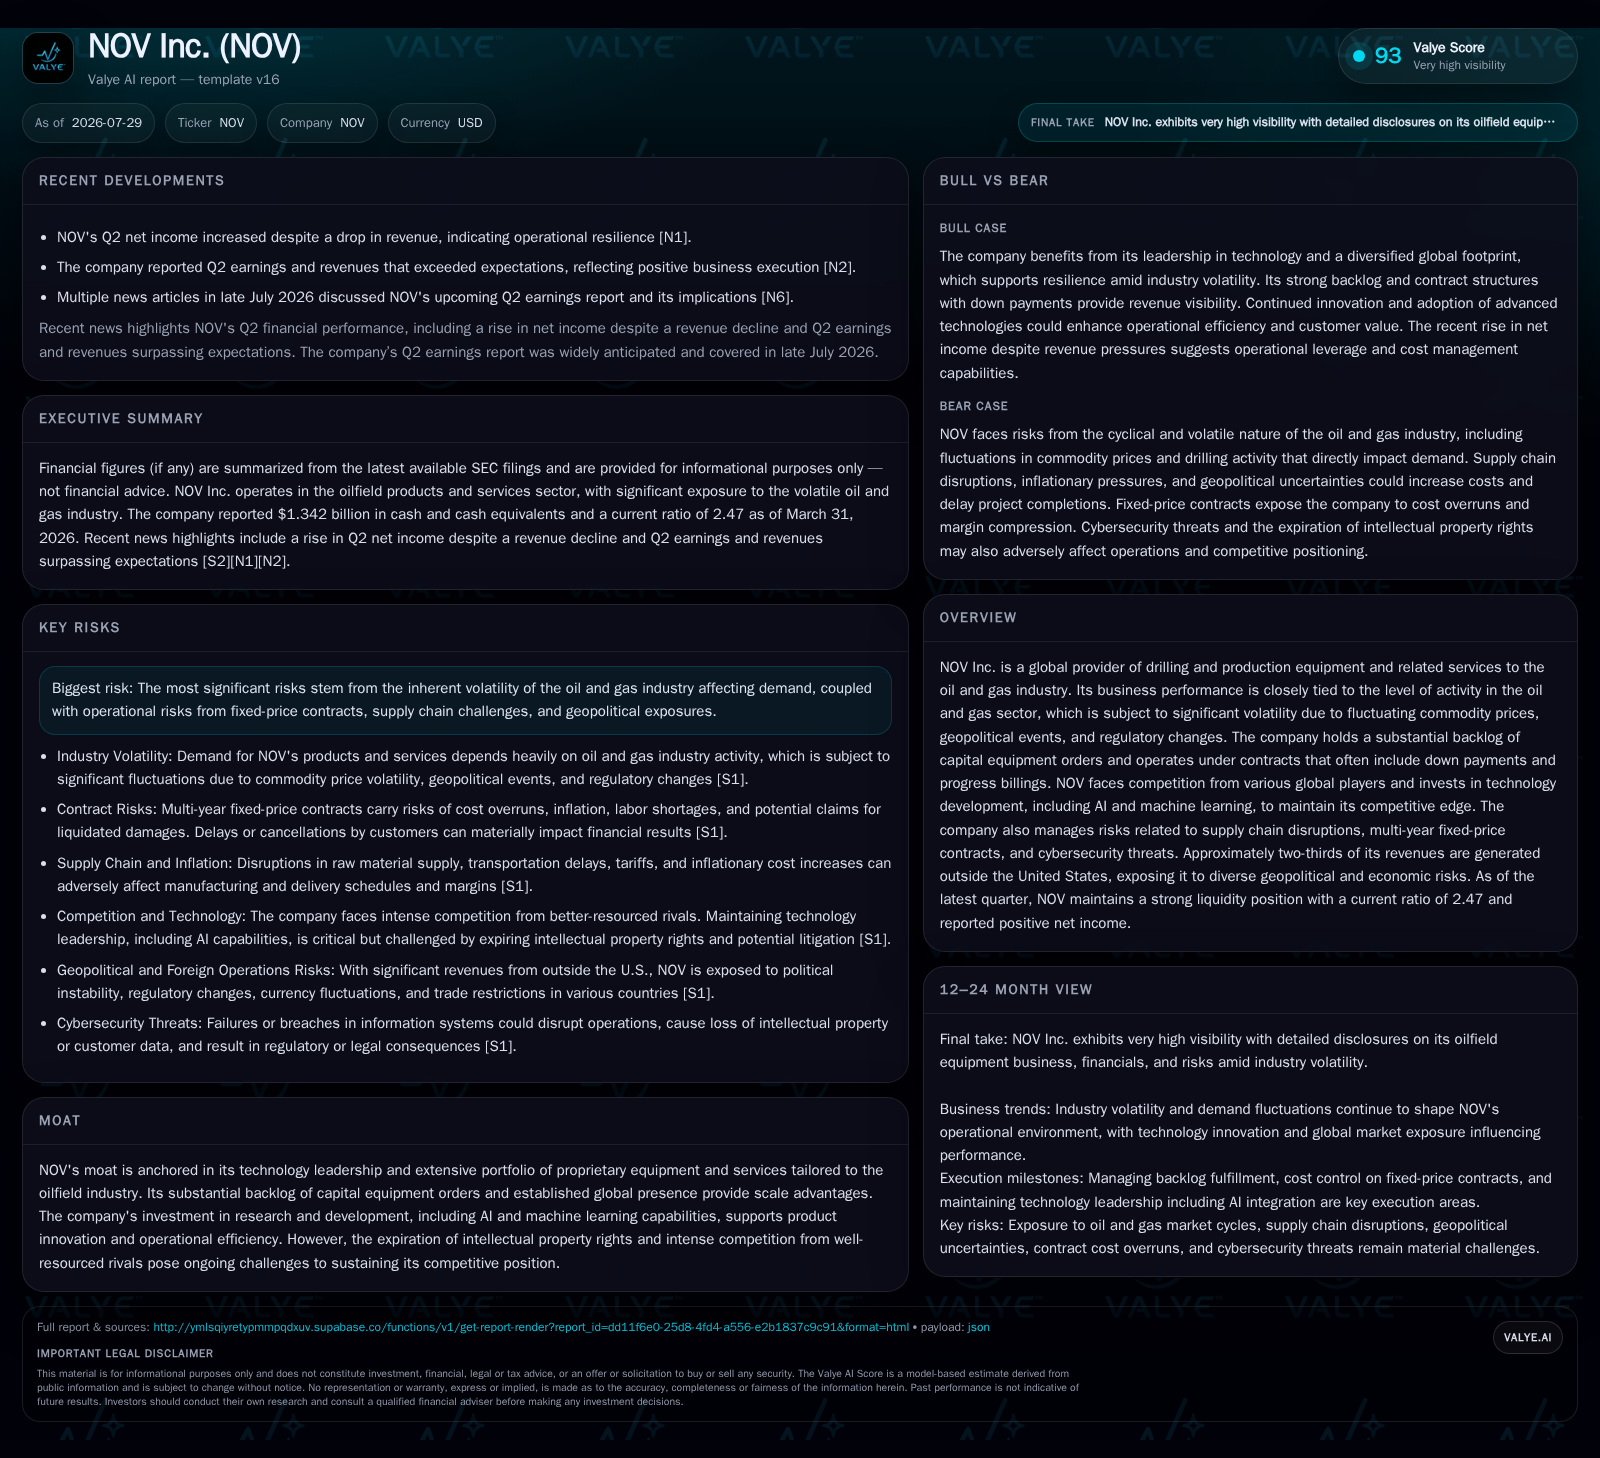
NOV Inc.’s latest quarterly results reflect the cyclical nature of the oilfield equipment sector, with a $4.34 billion capital equipment backlog offering near-term revenue visibility despite pressures from fluctuating commodity prices. The company maintains its competitive edge through technology investments, including AI and machine learning, which support operational efficiency and product innovation. Key risks include fixed-price contract exposures and supply chain disruptions that could impact margins. International revenue exposure adds geopolitical complexity but also diversification. Monitoring rig utilization trends and order book evolution is critical to assessing future performance.
Recent Operating Update
NOV Inc.’s second quarter ending June 30, 2026 demonstrated resilience amid fluctuating oilfield activity levels. While revenue declined slightly compared to prior quarters, the company reported an increase in net income driven by operational efficiencies and disciplined cost management [S2][N1][N2]. A key pillar supporting near-term revenue visibility remains NOV’s substantial backlog of $4.34 billion in capital equipment orders, reflecting sustained demand from upstream oil and gas operators for drilling rigs, production systems, and related equipment [S1][S23]. This backlog is secured through contracts involving significant down payments and progress billings, which mitigate cancellation risk but require vigilant margin management due to the prevalence of fixed-price contracts [S21][S28].
Business Model Analysis
NOV primarily manufactures and services drilling and production equipment for upstream oilfield operators. Its revenue streams derive from capital equipment sales—including rig components, wellheads, and surface processing systems—and from aftermarket service contracts that cover maintenance, repair, and operational support. The company’s business model emphasizes long-term customer relationships, with a sizable order backlog providing multi-quarter booking visibility.
Contracts typically incorporate milestone-based payments with substantial upfront deposits, which help fund manufacturing progress and reduce cash flow risk from cancellations or delays. However, this model exposes NOV to risks from cost estimation errors and inflationary pressures on raw materials and labor, which can compress margins if not offset by contract escalations or cost controls [S1][S28]. The margin profile varies by product mix, with higher-margin aftermarket services complementing lower-margin capital equipment sales. Technological differentiation, including proprietary designs and digital capabilities, serves as a key pricing lever.
NOV invests significantly in technology innovation, focusing on AI and machine learning applications that enhance drilling efficiency, safety, and predictive maintenance. These investments aim to maintain competitiveness against integrated peers such as Schlumberger and Baker Hughes, who also emphasize digital transformation and R&D [S1]. Protecting intellectual property and continuously innovating are critical to sustaining NOV’s competitive moat amid risks of IP expiration and aggressive industry innovation.
Industry Structure and Competitive Position
The oilfield equipment sector is characterized by pronounced cyclicality, driven by upstream capital expenditure decisions that respond to oil and gas commodity price volatility. Key demand indicators influencing NOV’s order intake include rig day rates, rig utilization, number of wells drilled, and workover activity levels [S1]
NOV competes with integrated oilfield service providers like Schlumberger and Baker Hughes, as well as specialized equipment manufacturers such as Weatherford International. Its competitive strengths include a broad product portfolio spanning drilling rigs to surface production systems, combined with global aftermarket service capabilities [S1][S29]. Approximately two-thirds of NOV’s revenue is generated internationally, which diversifies geographic exposure but introduces complexity through foreign regulatory environments, geopolitical risks—including sanctions and trade restrictions involving countries like Russia and Iran—and currency fluctuations
Competition is intense, especially during downturns when price sensitivity increases. Customers prioritize reliability, technological sophistication, ease of integration with existing assets, and comprehensive support services [S27][S28]. Fixed-price contracts dominate major equipment sales, creating margin risk when raw material costs or logistics expenses rise unexpectedly or when supply chain disruptions delay deliveries. NOV has faced challenges from global supply chain constraints affecting component availability and manufacturing lead times [S27][S28].
Growth Drivers
NOV’s growth is supported by expanding global oilfield activity as upstream operators increase exploration and production budgets in response to recovering energy demand [N5][N9]. Rising rig utilization rates globally drive aftermarket parts consumption, providing stable recurring revenue alongside new capital equipment sales
Technological advancements, including AI-driven drilling optimization and enhanced safety systems, contribute to efficiency gains that appeal to cost-conscious operators. Replacement cycles for aging drilling fleets and production infrastructure also stimulate demand for updated equipment that complies with evolving environmental regulations and incorporates digital capabilities.
Emerging markets offer additional growth opportunities where drilling modernization is less advanced. NOV leverages its established presence and localized service infrastructure in these regions to capture market share and support operators transitioning to more advanced technologies.
Risks and Watchpoints
Commodity price volatility remains the primary risk, as sustained low or unstable oil prices could reduce upstream capital expenditures, leading to order cancellations or delays despite the current backlog [S1]. Fixed-price multi-year contracts increase margin volatility, especially if cost forecasts prove inaccurate or inflationary pressures on labor and materials intensify.
Supply chain disruptions continue to pose operational risks, potentially extending manufacturing lead times and increasing costs, which could delay backlog conversion and compress margins [S27][S28]. Geopolitical risks linked to NOV’s international footprint include potential trade sanctions, labor disruptions, and currency volatility that may affect sales and supply chains.
Technological obsolescence is a concern as competitors invest aggressively in digital and AI capabilities. NOV must balance R&D spending with commercial returns amid industry cyclicality to maintain its technology leadership.
Regulatory changes imposing stricter environmental compliance requirements could increase product development complexity and capital costs for customers, potentially slowing purchasing decisions.
What To Watch Next
Key indicators to monitor include the pace of backlog execution relative to new bookings, with an improving book-to-bill ratio signaling demand recovery. Rig day rates and rig utilization globally remain leading indicators of upstream activity and order inflows.
Management commentary on supply chain normalization and inflation mitigation strategies will be critical to assessing margin sustainability. Progress in integrating AI and machine learning across product lines will influence NOV’s competitive positioning over the medium term.
Geopolitical developments affecting core international markets should be closely watched for potential impacts on regional sales and supply chain stability.
This analysis synthesizes publicly available filings and industry context without providing investment research views or forecasts beyond documented information.
Disclaimer: This is research-only, informational analysis and not investment advice. It may include AI-generated interpretation and general industry context. Always verify important details using primary sources.

Comments