
OFS Capital's Navigational Signal: Credit Quality Shifts and Leverage in Q2 2026
Latest quarterly disclosures reveal OFS Capital’s active credit risk management paired with strategic leverage adjustments amid shifting middle-market credit conditions.
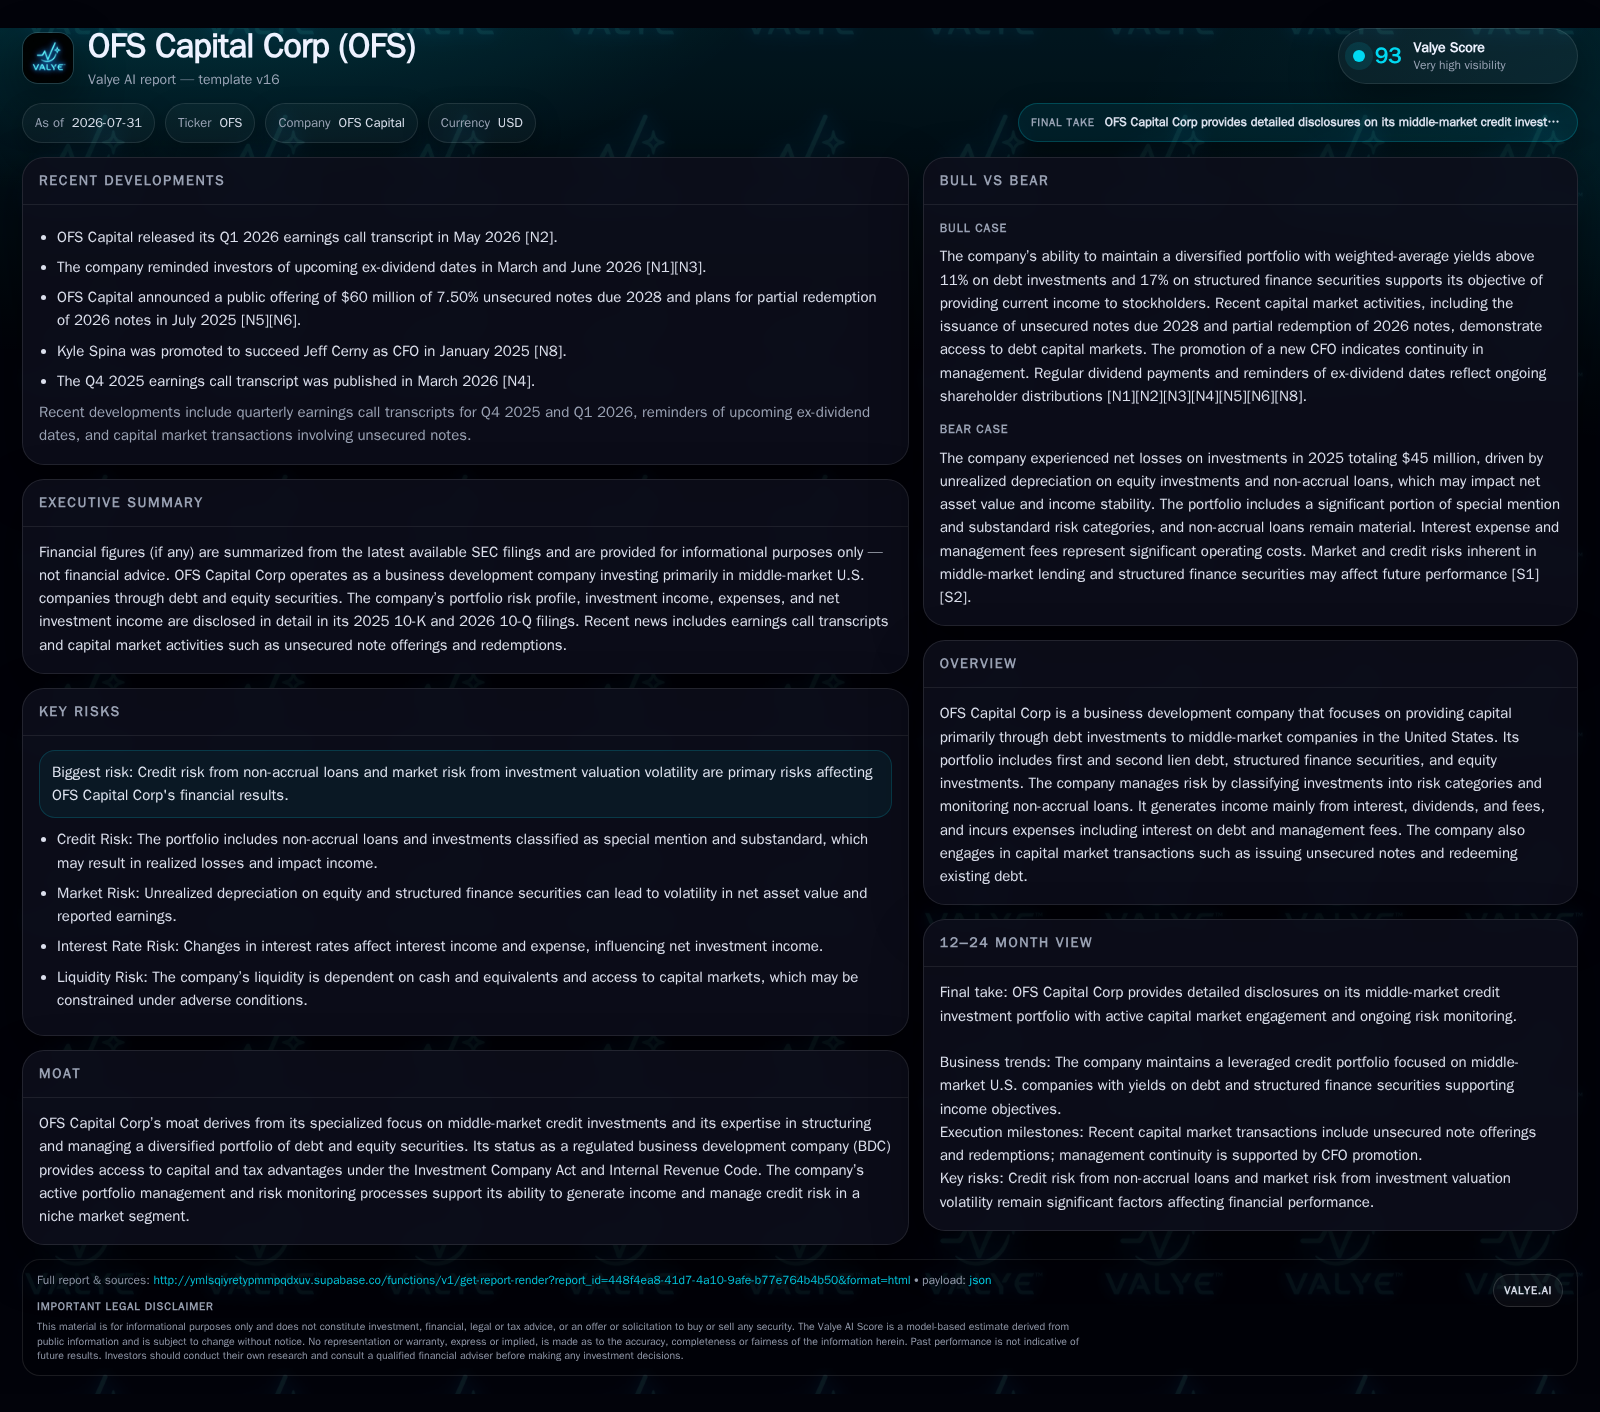
In its Q2 2026 filing, OFS Capital Corp demonstrates meaningful reductions in non-accrual loans, notably within first lien debt, signaling improved portfolio credit quality. The company's income generation remains driven primarily by interest and fee income from a diversified mix of first lien, second lien debt, and structured finance securities. Leverage levels remain controlled with total debt around $185.8 million at quarter-end, supported by sound liquidity. These operating trends position OFS Capital to navigate ongoing interest rate volatility and credit market challenges common in the middle-market lending sector.
Q2 Portfolio Risk Adjustments Highlight Credit Quality Dynamics
OFS Capital Corp’s latest 10-Q filing dated July 31, 2026 reveals a marked improvement in portfolio credit quality through Q2 as evidenced by reduced non-accrual loan balances. This contraction suggests active portfolio management focusing on workout resolutions or repayments of stressed assets. Given the typical priority of first lien loans within the capital structure — offering stronger downside protections — this reduction carries favorable implications for preserving net asset value (NAV) per share if sustained across subsequent quarters.
Second lien debt non-accruals exhibit a contrasting delivery with fair value rising modestly but remaining contained at roughly $6.9 million [S1]. The overall decline in total non-accruals from $20.8 million to $14.4 million across all debt classes underscores an incremental stabilization phase after prior periods marked by elevated credit losses. Monitoring these trends against future quarterly disclosures will confirm whether this recovery is durable or transient amid ongoing economic shifts.
Revenue Drivers Rooted in Debt Instrument Mix and Structured Finance Exposure
Dividend income, though secondary in scale, includes cash dividends and PIK dividends derived from equity securities embedded within the portfolio [S10], providing incremental diversification to income streams while introducing nuanced credit risk exposure.
Fee incomes arise primarily from syndication activities and prepayment fees ranging from nominal to low double-digits in thousands per quarter but contribute to stabilizing overall revenue volatility versus pure interest-based returns [S10]. This diversified revenue composition supports NII generation resilience even if certain asset classes underperform temporarily.
'Leverage Breathing Room': How OFS Manages Debt Costs Amid Interest Rate Risks
From a capital structure perspective, OFS Capital reported approximately $185.8 million in total debt as of June 30, 2026 with net debt logically near $181.8 million after factoring circa $4.0 million cash holdings [F1]. This level aligns with operational guidelines under the Investment Company Act that restrict business development companies (BDCs) like OFS from exceeding regulated leverage caps designed to constrain risk exposure.
Borrowing costs have been influenced by recent public note issuances featuring coupon rates between 4.95% and up to 8% fixed over terms expiring mostly around 2028–2029 [S3]. The weighted average effective interest rate hovered near mid-6% range through year-end 2025 [S1]. Recent refinancing initiatives clarifying funding sources — such as extension of Banc of California Credit Facility maturity to February 2028 — provide stability amid volatile rate environments [S5].
The company also employs limited derivative strategies permissible under BDC rules for managing interest rate exposure prudently without excessive complexity or regulatory constraint infringements [S1]. Such hedging mechanisms aim to moderate fluctuations between asset yields and funding costs to protect net investment income (NII).
'Watching the Non-Accrual Pulse': Risk Management Through Investment Grading Distribution
OFS Capital segments its portfolio into discrete risk grading tiers ranging from average to substandard categories with explicit data illustrating primary allocations around average risk (approximately 71% of fair value) complemented by special mention exposures near 25% as of end-2025 [S1]. The relatively modest substandard tranche (~4%) evidences surgical management of stressed credits.
This granularity enables targeted surveillance on potentially impaired credits triggering early interventions such as restructuring or reserve builds before formal non-accrual classification impacts earnings decisively. The balance between portfolio yield aspirations versus capital preservation is managed delicately through this regular assessment cycle.
'Navigating Competitive Currents': Industry Context on Middle-Market Lending Strategies
Within the broader BDC landscape serving middle-market companies largely underserved by traditional banks, OFS Capital’s focused strategy is comparable to peers like Ares Capital Corporation or Golub Capital BDC that blend asset-backed lending with structured finance components. These competitors similarly prioritize senior-secured first lien loans but may differentiate via scale or product breadth.
OFS’s portfolio diversification across loan seniority levels alongside investments in structured finance securities offers some mitigation against sector-specific downturns or idiosyncratic borrower stress situations common in middle-market lending. While these peers might maintain higher leverage ratios or broader distribution yields reflecting different risk appetites or capital structures, OFS appears more conservative leveraging structural protections afforded by its lending mix.
'Growth Horizons': Demand Drivers and Capital Market Access for Middle-Market Financing
Middle-market financing demand remains robust driven by limited bank appetite amidst regulatory tightening post-financial crises, providing fertile ground for BDCs including OFS Capital to deploy capital efficiently.[S3] Recent public offerings and unsecured notes issuances indicate active capital raising enabling growth while maintaining liquidity buffers.[S3]
Investor appetite persists for yield-generating assets amid lower bond market returns elsewhere, tempting institutional capital toward BDCs despite inherent credit risks [S22]. OFS’s access to both equity markets and secured/unsecured debt facilities enhances its ability to capitalize on growth opportunities consistent with regulatory leverage allowances.
'Caution Flags': Key Risks from Credit Exposure, Leverage Use, and Regulatory Oversight
Risk factors emphasized include credit deterioration manifesting through rising non-accrual loans which could pressure earnings neutrality given loss provisions; interest rate risk where funding cost increases may outpace yield expansions reducing NII; market valuation volatility impacting NAV stability; liquidity constraints limiting new originations during economic stress episodes; concentration risks where borrower defaults incur outsized impacts; leverage amplifying downside losses; operational limitations in underwriting precision; regulatory constraints particularly Section 61(a) limits affecting permitted borrowing levels; plus derivative usage rules imposing conservative hedging frameworks.
The interplay among these risks demands vigilant monitoring given cyclicality inherent in leveraged middle-market credit investing.
'Signals Ahead': Upcoming Milestones to Gauge Operating Execution and Market Positioning
Investors should track forthcoming quarterly results reflecting how recent reductions in non-accrual loans translate into sustained NAV per share stabilization or improvement.[N1][S2] Additional scrutiny on distribution payout consistency aligned with NII performance will indicate earnings quality. The company’s announced ex-dividend dates along with any capital raising plans flagged through public filings will further reveal strategic financial positioning linking market confidence.[N1,S3]
Portfolio turnover rates or new investment pipeline data when disclosed will provide early insight into growth trajectory alignment with middle-market demand conditions.
Financial Profile Discussion
As of June 30, 2026,[F1] OFS held approximately $4.0 million in cash equivalents juxtaposed against total outstanding debt near $185.8 million resulting in net indebtedness close to $181.8 million—a manageable leverage posture within typical BDC regulatory frameworks ensuring asset coverage above mandated floors.[F1]
Net investment income generation remains central to sustaining distributions critical for shareholder return profiles.[S10] Despite pressures seen earlier due to elevated non-accruals-induced losses, recent quarters suggest easing expense burdens—total expenses decreased sequentially aided by lower incentive fees—supporting improved operational profitability margins.
All conclusions emphasize operational changes discovered predominantly from latest quarter disclosures reinforcing incremental shifts rather than conjectured long-term forecasts.
Disclaimer: This is research-only, informational analysis and not investment advice. It may include AI-generated interpretation and general industry context. Always verify important details using primary sources.

Comments