
OGE Energy Corp. Expands Renewable Investments While Managing Regulatory and Capital Constraints
OGE Energy leverages regulated utility operations and infrastructure investments to target steady earnings growth amid regulatory complexities.
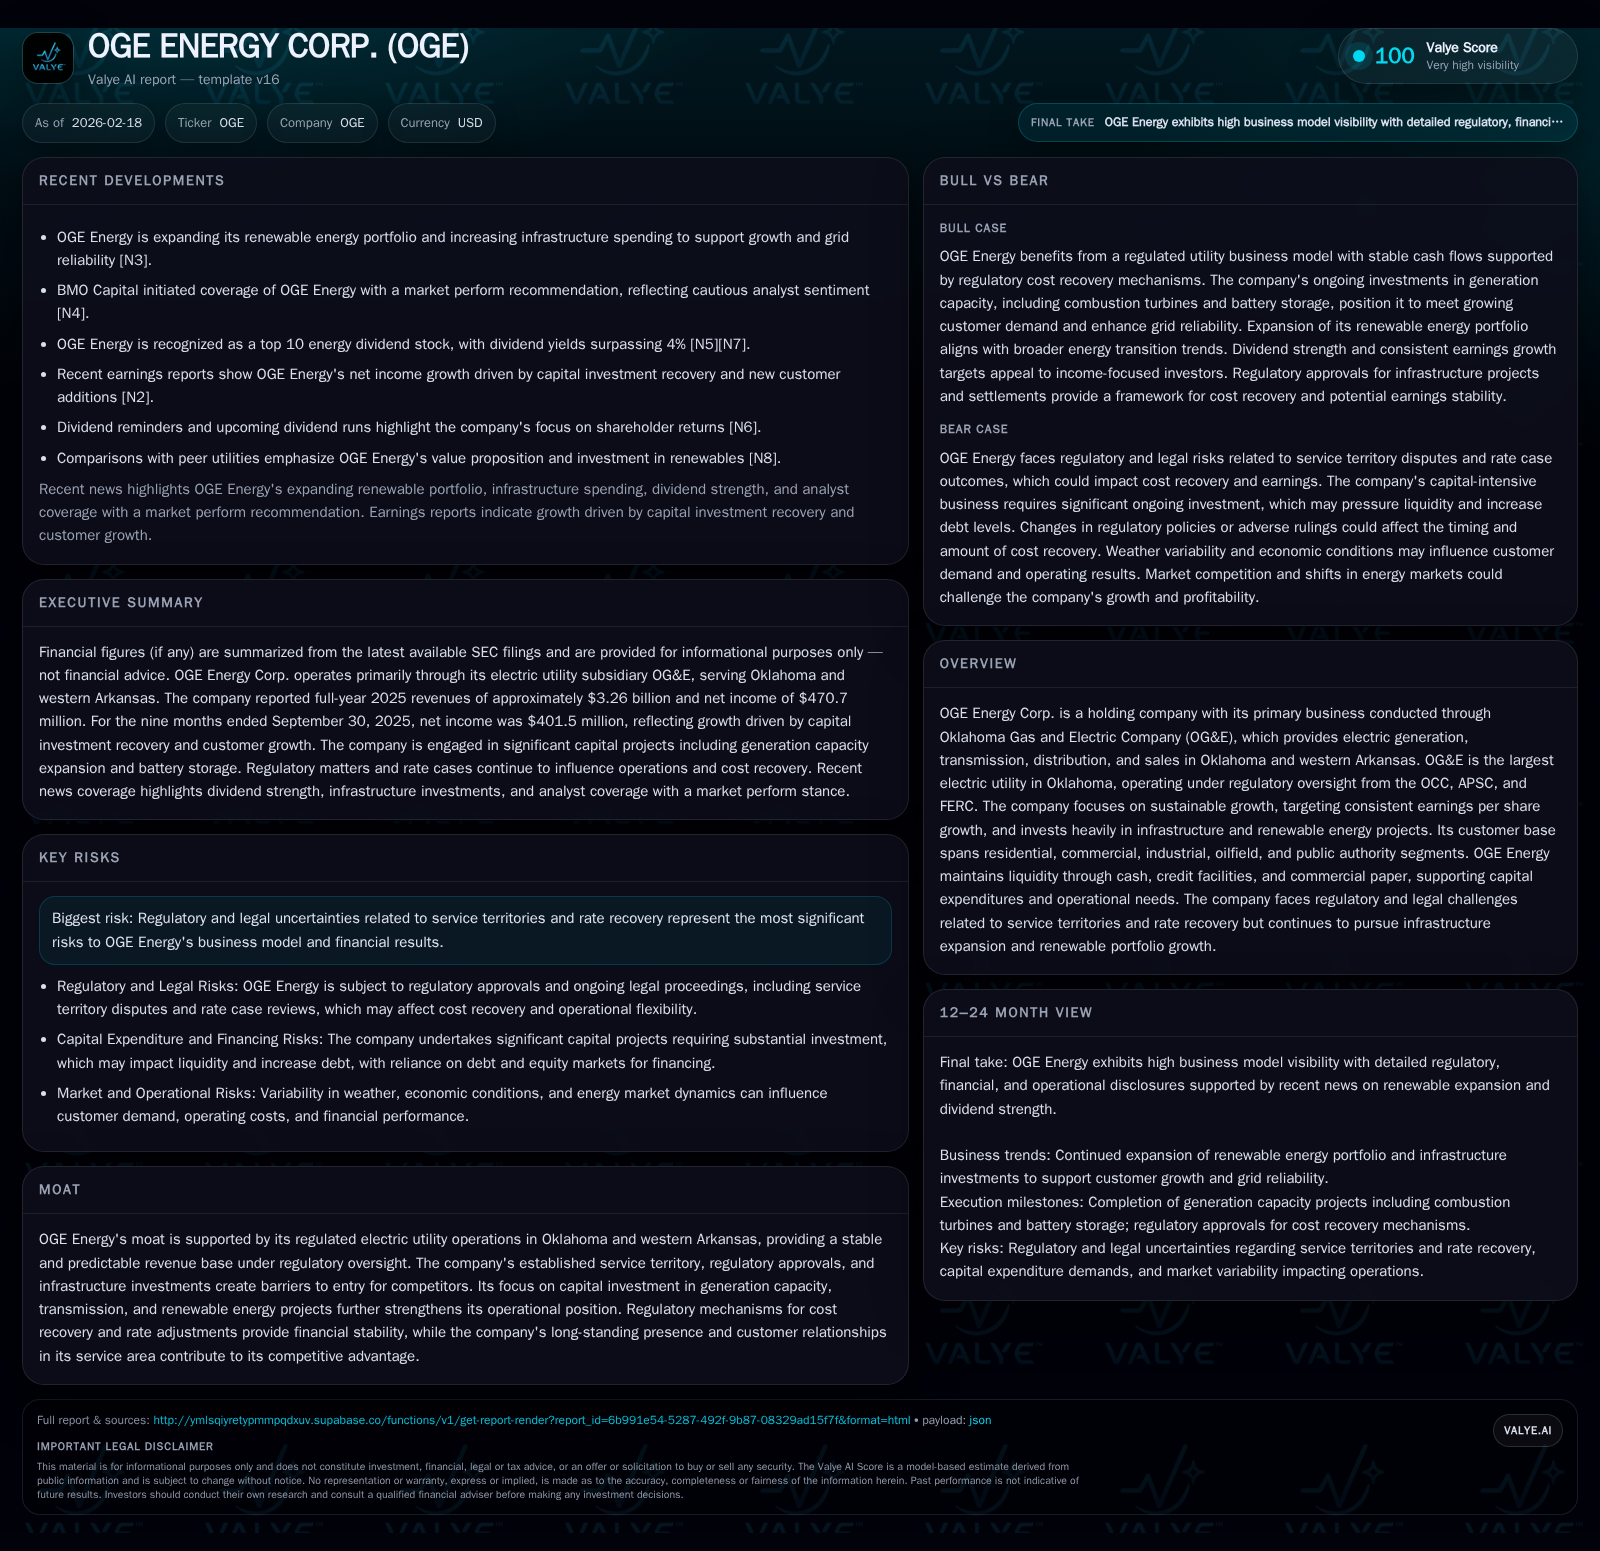
OGE Energy Corp. operates through its regulated subsidiary OG&E, the largest electric utility in Oklahoma, serving customers across diverse segments. The company has delivered steady revenue and earnings growth over recent years, driven by expanded infrastructure spending and renewable energy initiatives. Going forward, OGE aims for 5–7% EPS growth, supported by capital investments in generation capacity and grid upgrades, while managing risks from regulatory and legal uncertainties. Strong operating cash flows fund dividend payments, though capital expenditures remain high to support system resilience and load growth. Regulatory mechanisms provide financial stability but require navigating rate recovery challenges amid environmental and legislative changes.
Historical Financial Performance
OGE Energy Corp.'s consolidated revenues have shown a consistent upward trajectory over the past three years, growing from approximately $2.67 billion in FY2023 to $3.26 billion in FY2025—a roughly 9.2% year-over-year increase from 2024 to 2025 [F1]. Operating income mirrored this positive trend with a rise of over 7% last year, reaching nearly $799 million.
Historical performance (annual)
| FY | Rev ($bn) | Net ($mm) | CFO ($mm) | OpInc ($mm) | Rev YoY | Net YoY |
|---|---|---|---|---|---|---|
| 2025 | 3.3 | 471 | 1137 | 799 | +9.2% | +6.6% |
| 2024 | 3.0 | 442 | 813 | 745 | +11.6% | +5.9% |
| 2023 | 2.7 | 417 | 1232 | 650 | -20.8% | |
| 2022 | 3.4 | 843 | 650 |
Note: Omitted columns lack sufficient annual XBRL coverage in the provided tags (need ≥2 annual points): Capex, Buybacks. Source: SEC companyfacts cache [F1].
Capital returns and efficiency (annual)
| FY | Div ($mm) | FCF ($mm) | ROE% |
|---|---|---|---|
| 2025 | 342 | 83 | 9.5 |
| 2024 | 339 | -278 | 9.5 |
| 2023 | 333 | 54 | 9.2 |
| 2022 | 329 | -208 |
Source: SEC companyfacts cache [F1].
Note: Buybacks data insufficient for inclusion.
Net income growth has been more moderate but steady, supporting an approximate ROE of around 9.5% by end-2025—the figure reflects a stable profitability profile given the capital-intensive nature of utility operations [F1]. Operating cash flows (CFO) experienced a marked increase in FY2025 after a dip in FY2024, supporting ongoing capital expenditures and dividend distributions.
Business Model and Moat
OGE’s moat is centered on its position as the largest electric utility in Oklahoma via its wholly owned subsidiary OG&E, which serves approximately 913,000 customers covering residential to industrial sectors under exclusive franchise territories [S9]. Its regulated status under the Oklahoma Corporation Commission (OCC), Arkansas Public Service Commission (APSC), and Federal Energy Regulatory Commission (FERC) provides stable revenue through cost recovery mechanisms embedded within retail electric tariffs.
Regulatory oversight requires OG&E to obtain approval for rate adjustments that allow recovery of fuel costs, capital investments, depreciation, and operating expenses, creating high entry barriers for competitors while ensuring predictable cash flows [S14]. Moreover, OG&E's investment in infrastructure—such as transmission upgrades and renewable projects—further solidify its operational footprint.
Future Growth Prospects
OGE targets annual consolidated earnings per share growth between five and seven percent by combining strong load growth with low customer rates designed to retain competitiveness [S2]. This growth is underpinned by substantial capital deployment plans focused on:
- Transmission system modernization aimed at bolstering grid resiliency against increased extreme weather volatility common in its service areas;
- Expansion of renewable assets including multiple wind farms (Centennial, OU Spirit, Crossroads), leveraging land leases extending up to around ten years with escalated rents tied to inflation indices [S1];
- Investment in new natural gas generation facilities made financially viable through recent Oklahoma legislation (SB998) allowing CWIP recovery prior to plant operation commencement—improving cash flow timing and reducing financing costs [S2].
Additionally, OG&E’s Integrated Resource Plan (IRP) submitted in late-2025 guides these initiatives aligning supply-side resources with projected customer demand while meeting environmental goals.
However, growth is constrained by several factors including regulatory uncertainties regarding service territories and rate-setting outcomes that may limit timely cost recovery or impose disallowances [S14][S16]. Environmental compliance requirements could also elevate operational costs despite ongoing efforts toward sustainability.
Capital Allocation & Returns
Capital allocation reflects a heavy emphasis on maintaining system reliability through significant capex exceeding $1 billion annually over recent years—with a slight decline from $1.18 billion in FY2023 to about $1.05 billion in FY2025—focused primarily on transmission/distribution enhancements and generation fleet modernization [F1][S7].
Operating cash flow has sufficiently covered these expenditures along with dividend payouts which totaled roughly $342 million in 2025, showing incremental increases aligned with earnings growth [F1]. Free cash flow remains modest but positive at approximately $82 million after capex—a characteristic typical for utilities balancing growth with regulated returns.
Notably absent are share repurchases since early last decade; thus capital return policies prioritize dividends over buybacks currently [F1]. Leverage covenants restrict dividend distributions indirectly by capping total debt-to-capitalization ratios at holding company (70%) and subsidiary (65%) levels respectively; however OG&E holds over $3 billion of retained earnings unrestricted for dividends ensuring flexibility without breaching covenants [S20][S8].
Long-term debt issuance activities continued in April 2025 when OG&E raised $350 million senior notes at a coupon rate of nearly six percent maturing in three decades—proceeds largely directed towards refinancing short-term borrowings plus sustaining capex funding requirements [S6][S11]. Revolving credit lines totaling approximately $1.16 billion remain available to cover interim financing needs providing liquidity buffer amidst market fluctuations.
Regulatory Environment & Risks
Approximately eighty-eight percent of electric revenue derives from Oklahoma regulator OCC jurisdiction while Arkansas accounts for around seven percent; both bodies enforce stringent rules relating accounting transparency, transaction monitoring among affiliates, and tariff fairness ensuring consumer protection though sometimes complicating timely cost pass-throughs during volatile fuel price environments [S14]. FERC oversees transmission pricing and short-term borrowing authority adding federal layer oversight.
OG&E recently completed a rate review process finalizing settlements permitting incremental rate relief but continues managing residual issues tied to specific megawatt-hour matters per regulatory orders dated March-April 2025 [S2]. Legislative landscape adaptations such as SB998 positively affect project economics but also increase scrutiny on prudency determinations during regulatory hearings.
Legal exposures include ongoing litigation tied to a significant fire event at an apartment construction site resulting in claims exceeding $60 million; management anticipates prevailing through insurance coverage net of deductibles while recognizing inherent unpredictability as risk factor [S16][S18].
Environmental regulations impose further constraints demanding continued investments into pollution controls affecting upfront costs as well as operational expense profiles though compliance programs are reportedly effective with no material penalties currently anticipated.
Industry Context Analysis
From an industry standpoint, OGE operates within a traditionally capital-intensive sector characterized by slow-evolving load growth paired with rising expectations for cleaner energy transition—all regulated utilities face parallel challenges balancing renewable integration incrementally without destabilizing reliability or imposing disproportionate cost burdens on customers.
The shift towards electrification trends regionally combined with technological advances such as advanced metering infrastructures (AMI), grid automation contribute positively though offset by necessary compliance mandates structures production overheads tightly within allowed returns parameters enforced by regulators.
What To Watch Next
- Outcomes of any pending or upcoming regulatory reviews impacting allowed rates or deferred cost recoveries;
- Progression of renewable project development timelines balanced against legislative environment shifts;
- Credit rating agency outlook revisions given recent negative outlook signals related to increased leverage stemming from aggressive capex programs;
- Legal developments concerning contingent liabilities arising from litigation events;
- Quarterly operational metrics especially customer additions/load growth responding to regional economic drivers.
Disclaimer
This analysis is prepared solely for informational purposes based on publicly available data as of February 18, 2026. It does not constitute investment advice or recommendations regarding buying or selling securities. Readers should conduct their own due diligence or consult financial advisors before making investment decisions.
Disclaimer: This is research-only, informational analysis and not investment advice. It may include AI-generated interpretation and general industry context. Always verify important details using primary sources.
Comments