
O'Reilly Automotive Leverages Dual Market Strategy Amid Modest Macroeconomic Headwinds
Strong distribution and customer service underpin O'Reilly’s growth despite margin pressures and elevated debt.
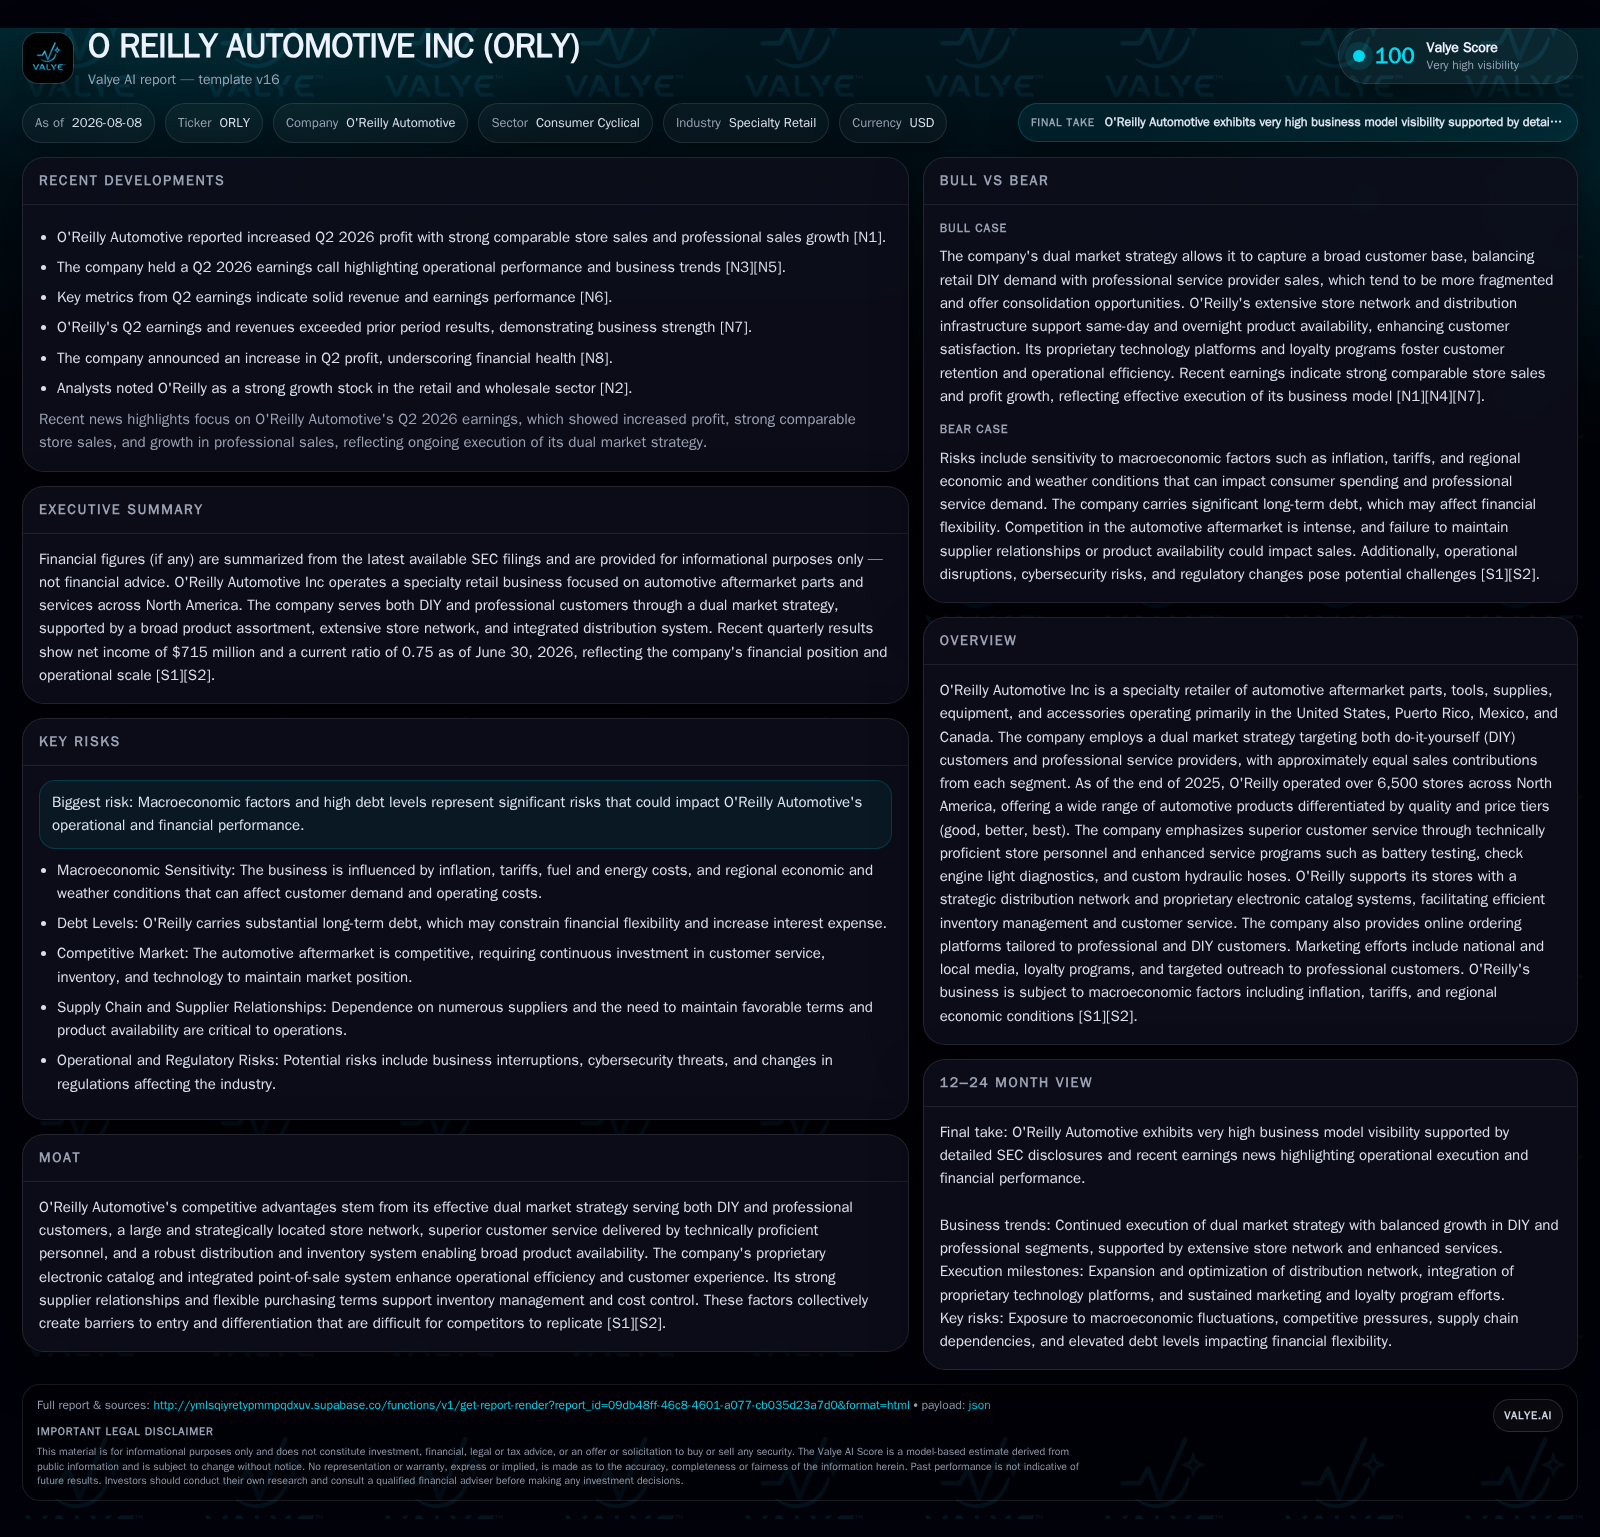
In its latest quarter ended June 30, 2026, O'Reilly Automotive reported revenue growth driven by both its DIY and professional customer segments, supported by its large store footprint and robust supply chain. The company continues to differentiate through technically proficient staff and a tiered product assortment, leveraging a sophisticated electronic catalog system. While macroeconomic factors create some near-term volume challenges, O'Reilly’s strategic distribution network and service programs sustain competitive positioning. Elevated debt levels remain a watchpoint but covenant compliance and liquidity sources mitigate immediate financial risk.
Recent Operating Update
O'Reilly Automotive's Q2 2026 results highlight continued top-line growth in a challenging aftermarket environment. Revenues for the three months ended June 30 rose to $4.892 billion from $4.525 billion in the prior year period [S2], driven by balanced strength across its dual customer base — do-it-yourself (DIY) customers and professional service providers. This improvement is notable given ongoing macroeconomic uncertainty impacting consumer discretionary spending on vehicle maintenance.
Cost of goods sold also increased commensurately to about $2.375 billion from $2.199 billion the previous year period [S2], reflecting higher inventory levels necessitated by store count expansion and broad product assortments. The firm reports using a tiered product offering ('good, better, best') tailored to varying price sensitivity across regions and customer segments [S1].
Notably, O'Reilly’s proprietary electronic catalog system integrates with its point-of-sale platform to optimize SKU availability across stores and support rapid fulfillment from strategically located distribution centers. The scale of its distribution network—supporting over 6,500 stores in the U.S., Mexico, Canada, and Puerto Rico—remains a critical competitive asset allowing high inventory turnover rates typical for successful retailers in the automotive aftermarket specialty sector [S1]
Business Model Analysis
O'Reilly generates revenue primarily through direct sales of automotive aftermarket parts, tools, supplies, equipment, and accessories via its extensive physical retail presence supplemented increasingly by e-commerce channels. Its two principal customer groups are DIY vehicle owners performing repairs themselves and professional service providers who purchase parts frequently in bulk.
This balanced dual-market approach differentiates O'Reilly from peers that tend to skew more towards one segment—for example, AutoZone similarly serves both markets but often emphasizes DIY, while Advance Auto Parts shows stronger concentration in pro customers. Serving professionals requires deep technical expertise at stores; O’Reilly employs highly trained "Professional Parts People" who provide expert advice and technical services like battery testing or check engine diagnostics that build strong customer loyalty [S1].
Revenue mechanics involve transaction volume driven by store traffic (footfall), average ticket size influenced by product mix (higher-priced specialty items or accessories), and same-store sales growth reflecting organic demand trends. Margins benefit from a blend of tiered pricing strategies—offering value-tier products alongside premium options—and efficient inventory management enabled through the integrated electronic catalog.
The company mitigates risks related to stock-outs or overstocking via sophisticated replenishment logistics across multiple regional distribution centers that feed the store network quickly [S1]. Efficient inventory turnover enhances gross margin stability given the perishability risk of certain SKUs due to changing vehicle models or technology shifts.
Industry Structure and Competitive Position
The automotive aftermarket specialty retail industry is highly dependent on scale economies in distribution and retail footprint density. Success depends not only on breadth of product assortment but also on technical service quality offered in-store—a factor where O'Reilly consistently invests.
With over 6,500 stores across North America as of early 2026, O’Reilly commands one of the largest footprints in this sector alongside competitors such as AutoZone (6,000 stores) or Advance Auto Parts (5,000 stores). This scale supports bargaining power with suppliers on pricing and credit terms while enabling faster delivery cycles from multiple distribution centers.
Peer comparison underscores O'Reilly’s emphasis on customer service technical expertise as a differentiator; this aspect supports higher retention rates among professional customers who value expertise critical for complex repairs requiring precise part specifications—a challenge growing with increasing vehicle complexity.
Furthermore, proprietary IT systems including an electronic catalog that integrates with POS systems afford operational efficiencies that raw big-box retailers or online marketplaces find difficult to match because they lack localized inventory depth or specialized staff support.
Growth Drivers
Several secular tailwinds underpin O’Reilly's growth outlook: Rising vehicle age across North America increases demand for replacement parts; vehicles being kept longer naturally lead to more frequent repairs compared to new car warranty periods. Similarly, growing complexity in vehicle technology necessitates specialized aftermarket parts which favor retailers with technical expertise like O’Reilly.
Growth in professional automotive service providers offers an expanding addressable market segment; these pro customers generate repeat volume purchases due to their business reliance on parts availability.
Additionally, ongoing expansion in store count combined with strategic densification in existing markets incrementally enhances geographic coverage advantages over peers—especially important for prompt just-in-time servicing critical in repair shops.
E-commerce enhancements aligned with omnichannel capabilities also allow O’Reilly to capture digital buyers while leveraging physical stores as fulfillment points — an increasingly standard model among specialty retailers adapting to consumer expectations for speed and convenience.
Inventory management improvements via data analytics optimize SKU stocking mix reducing working capital tied up in slow-moving parts while elevating availability metrics that directly drive sales conversion rates.
Risks & Watchpoints
Significant risks include macroeconomic volatility adversely impacting discretionary maintenance budgets for DIY consumers leading to fluctuating comparable store traffic. Inflationary pressures could compress gross margins if cost pass-through is limited by competitive price sensitivity.
Labor market tightness presents execution risk for maintaining highly trained store personnel essential for delivering superior service experience crucial for brand differentiation. Supply chain disruptions remain potential constraints on SKU availability given the global sourcing complexities of auto parts.
Another risk lies in evolving auto technologies such as increased penetration of electric vehicles which may reduce demand for certain traditional combustion engine parts over time.
Finally, O’Reilly's sizable debt load (around $6 billion net debt as of Q2 2026) places importance on sustained cash flow generation to meet interest obligations without jeopardizing investment capacity [F1][S5]
What to Watch Next
Key milestones include monitoring quarterly same-store sales growth trends broken down between DIY and professional segments to assess demand resilience amid economic fluctuations [S2]. Tracking changes in average ticket size will indicate shifts toward higher-margin products or accessories.
Expansion velocity regarding new store openings will signal sustained confidence in geographic coverage strategy alongside corresponding incremental contribution margin improvements.
Inventory turnover improvements or changes may hint at better working capital efficiency or emerging supply bottlenecks.[S2]
On finance front, upcoming debt maturities and any refinancing activities should be watched carefully for potential covenant impacts or cost-of-capital shifts given current interest rate environment [S5]
Retail labor market developments impacting team member productivity or customer satisfaction scores will inform whether competitive advantage via technical expertise remains intact.[S1]
Financial Profile Discussion
As of June 30, 2026, O’Reilly held cash and equivalents totaling approximately $262 million against total current assets around $7.2 billion contrasted with current liabilities near $9.57 billion—resulting in a sub-1x current ratio around 0.75 indicative of working capital pressure partly attributable to inventory investment supporting growth initiatives [F1][S2]
Total long-term debt stood above $7 billion largely including various unsecured senior notes spanning maturities through 2036 at fixed coupon rates between ~1.75% to ~5.75%[S22]. Net debt approaches approximately $6 billion after cash offsets [F1].
The company maintains compliance with all credit agreement covenants including leverage ceilings (max consolidated leverage ratio of 3.50x EBITDA) as well as fixed charge coverage ratios enhancing liquidity visibility [S5][S21]
A Commercial Paper Program established in August 2023 provides flexibility for short-term funding needs up to $2.25 billion complementing the primary revolving credit facility carrying zero outstanding borrowings at quarter end [S16][S21]
Free cash flow generation remains critical given leverage; historically positive EBITDA margins reflect efficient cost control despite inflationary pressures on cost of goods sold including warehouse/distribution expenses [S2]
Overall financial structure balances aggressive expansion investments with manageable liquidity risks mitigated by diversified funding sources backed by solid operating cash flows intrinsic to the specialty retail model.
This analysis synthesizes recent SEC filings through August 7, 2026 ([S1],[S2],[S3]) alongside the companyfacts database ([F1]) under Valye News editorial policy focusing on business model specificity without providing investment advice.
Disclaimer: This is research-only, informational analysis and not investment advice. It may include AI-generated interpretation and general industry context. Always verify important details using primary sources.

Comments