
OneSpan Inc. Posts Steady Profit Growth While Strengthening Capital Position
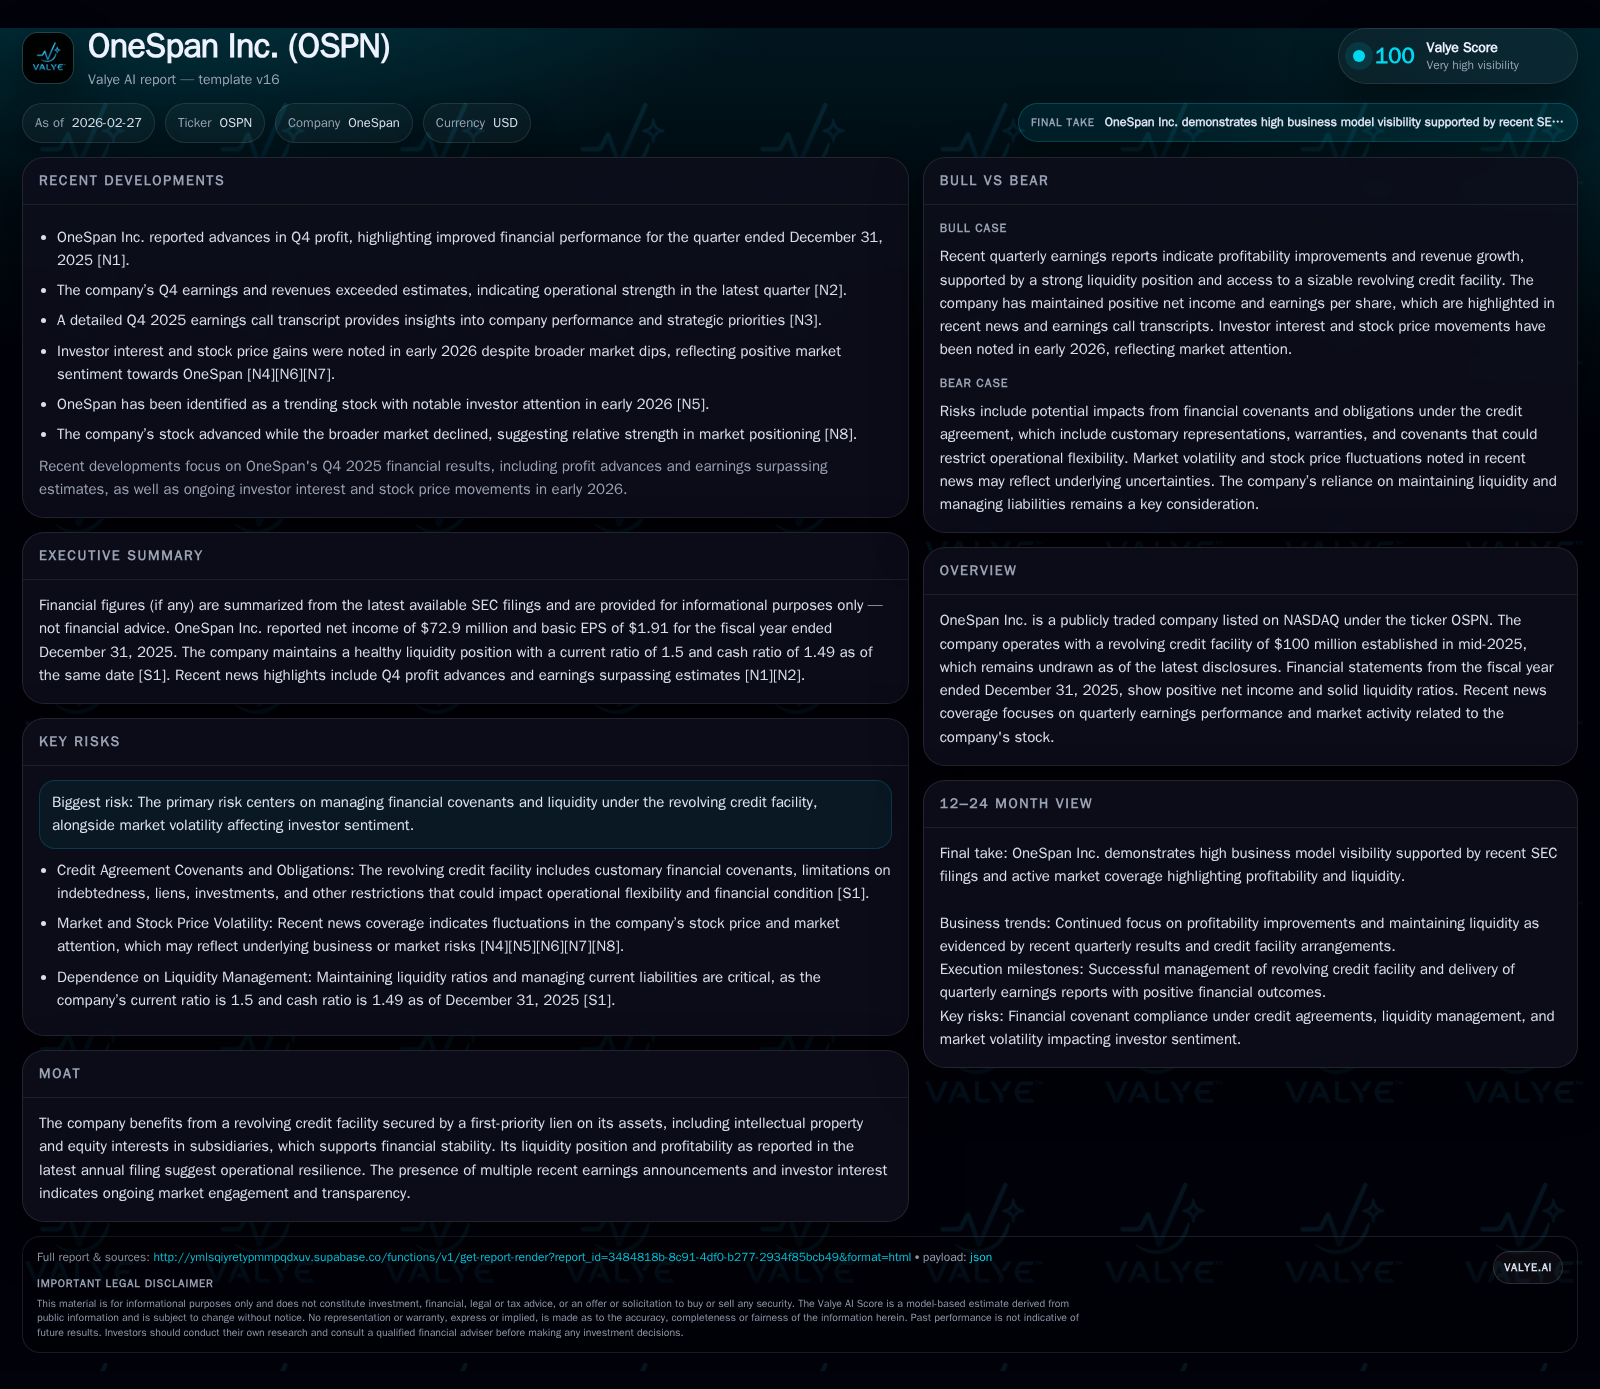
OneSpan delivers notable increases in net income and operating cash flows in 2025 alongside robust liquidity supported by an undrawn revolving credit facility.
In fiscal 2025, OneSpan Inc. advanced its financial performance with revenue rising approximately 14.5% year-over-year and net income surging by nearly 28%, reflecting effective operating leverage and cost control. The company’s liquidity remains strong, anchored by a $100 million revolving credit facility secured by first-priority liens on intellectual property and subsidiaries’ equity, which continues undrawn to preserve financial flexibility. Capital allocation balances share repurchases with ongoing investing activities, supporting sustained profitability and shareholder returns while managing covenant compliance amid market fluctuations.
Strong Historical Growth Backed by Operating Leverage
OneSpan's fiscal year 2025 performance reflects significant operational improvement compared to recent history. Total revenue increased approximately 14.5% year-over-year, rising from $47.6 million in FY2024 to $54.6 million in FY2025 [F1]. This growth accompanied a marked rebound in operating income, climbing 8.1% from $44.8 million to $48.4 million over the same period — evidence of the company's ability to convert incremental revenue into operating profits efficiently.
More striking is the net income performance, which surged by 27.7%, reaching $72.9 million in FY2025 versus $57.1 million in FY2024 [F1]. The sizable jump suggests effective cost controls and possibly favorable mix effects or improved pricing power within their recurring revenue streams. Operational cash flow also turned decisively positive at $59.5 million, a 6.8% increase that contrasts starkly with the negative cash flows recorded in FY2023 and FY2022 [F1]. This combination indicates that OneSpan has leveraged its business scale toward sustainable earnings quality.
Historical performance (annual)
| FY | Net ($mm) | CFO ($mm) | OpInc ($mm) | Capex ($mm) | Net YoY |
|---|---|---|---|---|---|
| 2025 | 73 | 59 | 48 | 9 | +27.7% |
| 2024 | 57 | 56 | 45 | 9 | +12843.8% |
| 2023 | 0 | -11 | 2 | 12 | +114.2% |
| 2022 | -3 | -6 | -4 | 5 |
Source: SEC companyfacts cache [F1].
Capital returns and efficiency (annual)
| FY | Buybacks ($mm) | FCF ($mm) | ROE% |
|---|---|---|---|
| 2025 | 13 | 50 | 26.8 |
| 2024 | 0 | 46 | 26.9 |
| 2023 | 29 | -23 | 0.3 |
| 2022 | 6 | -11 | -1.5 |
Source: SEC companyfacts cache [F1].
Liquidity Strength and Revolving Credit Facility: Pillars of Financial Stability
OneSpan’s liquidity foundation is strengthened by its revolving credit facility arranged mid-2025 for $100 million, which remains undrawn as of the latest disclosures [S4][S11][S16]. The credit agreement grants MUFG Bank administrative rights with provisions including a $10 million letter of credit sublimit and maturity set in June 2030.
The facility is secured via a first-priority lien on substantially all assets, including vital intellectual property rights and equity ownership interests in subsidiaries — a critical collateral structure that enhances lender comfort and supports borrowing terms [S4][S11]. Interest rates vary depending on the leverage ratio but generally range between a base rate plus approximately 1% to term SOFR-based loans plus up to an additional spread.
The agreement includes customary affirmative and negative covenants covering indebtedness limits, asset dispositions, restricted payments, and affiliate transactions—financial discipline imperatives management must meet to avoid default risks [S4][S11]. As of December-end, OneSpan reported a current ratio of approximately 1.5x with current assets standing at $172 million versus current liabilities of $114.6 million [F1], signaling ample short-term asset coverage.
Profitability Improvements: What the Numbers Reveal for 2025
The profitability profile demonstrated through a net income figure near $73 million — up sharply from the previous year — underscores not only growth but margin expansion fostered by recurring software-related revenues coupled with stringent cost management [N3][F1][S1]. Operating income progression mirrors this trend with steady improvement complementing robust revenue gains [F1].
Capital Deployment: Balancing Buybacks and Operational Investments
Free cash flow generation stands at approximately $50.5 million for FY2025 (operating cash flow less capital expenditures), highlighting solid internal capital creation capacity [F1]. Capital expenditures totaled $9 million in FY2025, representing a modest decline from the prior year’s level [F1], suggesting disciplined investment aimed at maintaining competitive technological capabilities.
Simultaneously, OneSpan executed share repurchases aggregating nearly $13.1 million during the year—a pronounced increase relative to minimal buyback activity seen previously—indicating an intensified focus on returning value to shareholders while maintaining balance sheet health [F1][S12]. This dual approach exemplifies tactical capital allocation conducive to supporting both growth initiatives and investor interests.
Risk Management: Navigating Covenants and Market Sentiments
Primary risks center on liquidity constraints and covenant adherence within its revolving credit facility framework—both closely monitored given market conditions characterized by elevated volatility [N4][N5][S5][S6][S7]. Restrictive covenants—including maximum leverage thresholds and limitations on restricted payments—necessitate vigilant treasury management to prevent defaults.
Investor sentiment has fluctuated throughout early-to-mid-2025 as evidenced by stock movement narratives reflecting broader market headwinds rather than company-specific setbacks [N4]. Proactive communication via frequent earnings releases reinforces transparency—a critical mitigation tactic amidst external uncertainties.
Operational risks related to legal proceedings disclosed in filings have not visibly impeded core financial metrics thus far [S1][S5]. Maintaining a robust liquidity buffer positions management favorably should market or regulatory challenges intensify.
What to Monitor Next: Earnings Trends and Capital Flexibility
Without explicit forward guidance or detailed forecasts available publicly [N2][S3], key indicators for ongoing evaluation include upcoming quarterly earnings reports tracking revenue growth consistency and margin stability amid competitive pressures.
Management decisions around potential credit facility drawdowns would signal shifts either towards opportunistic acquisitions or navigating unforeseen liquidity needs—the undrawn status post-2025 indicates presently ample internal cash sufficiency but warrants attention given macroeconomic uncertainties.
Capital return programs remain an area ripe for observation: whether share repurchase levels maintain upward momentum or pivot towards dividend initiation could influence shareholder value perception materially.
Lastly, evolving regulatory or litigation outcomes should be tracked given embedded risk exposure documented in SEC risk factor disclosures [S6][S7].
This analysis synthesizes publicly available filings and news reporting without extrapolating beyond verified data points or speculating on future outcomes beyond factual interpretation based on provided sources.
Disclaimer: This is research-only, informational analysis and not investment advice. It may include AI-generated interpretation and general industry context. Always verify important details using primary sources.
Comments