
Ouster Inc. Advances Digital Lidar with Expanding Platform Amid Profitability Challenges
Ouster’s latest quarter underscores steady revenue growth driven by digital lidar innovation and expanded sensing platform, against ongoing net losses.
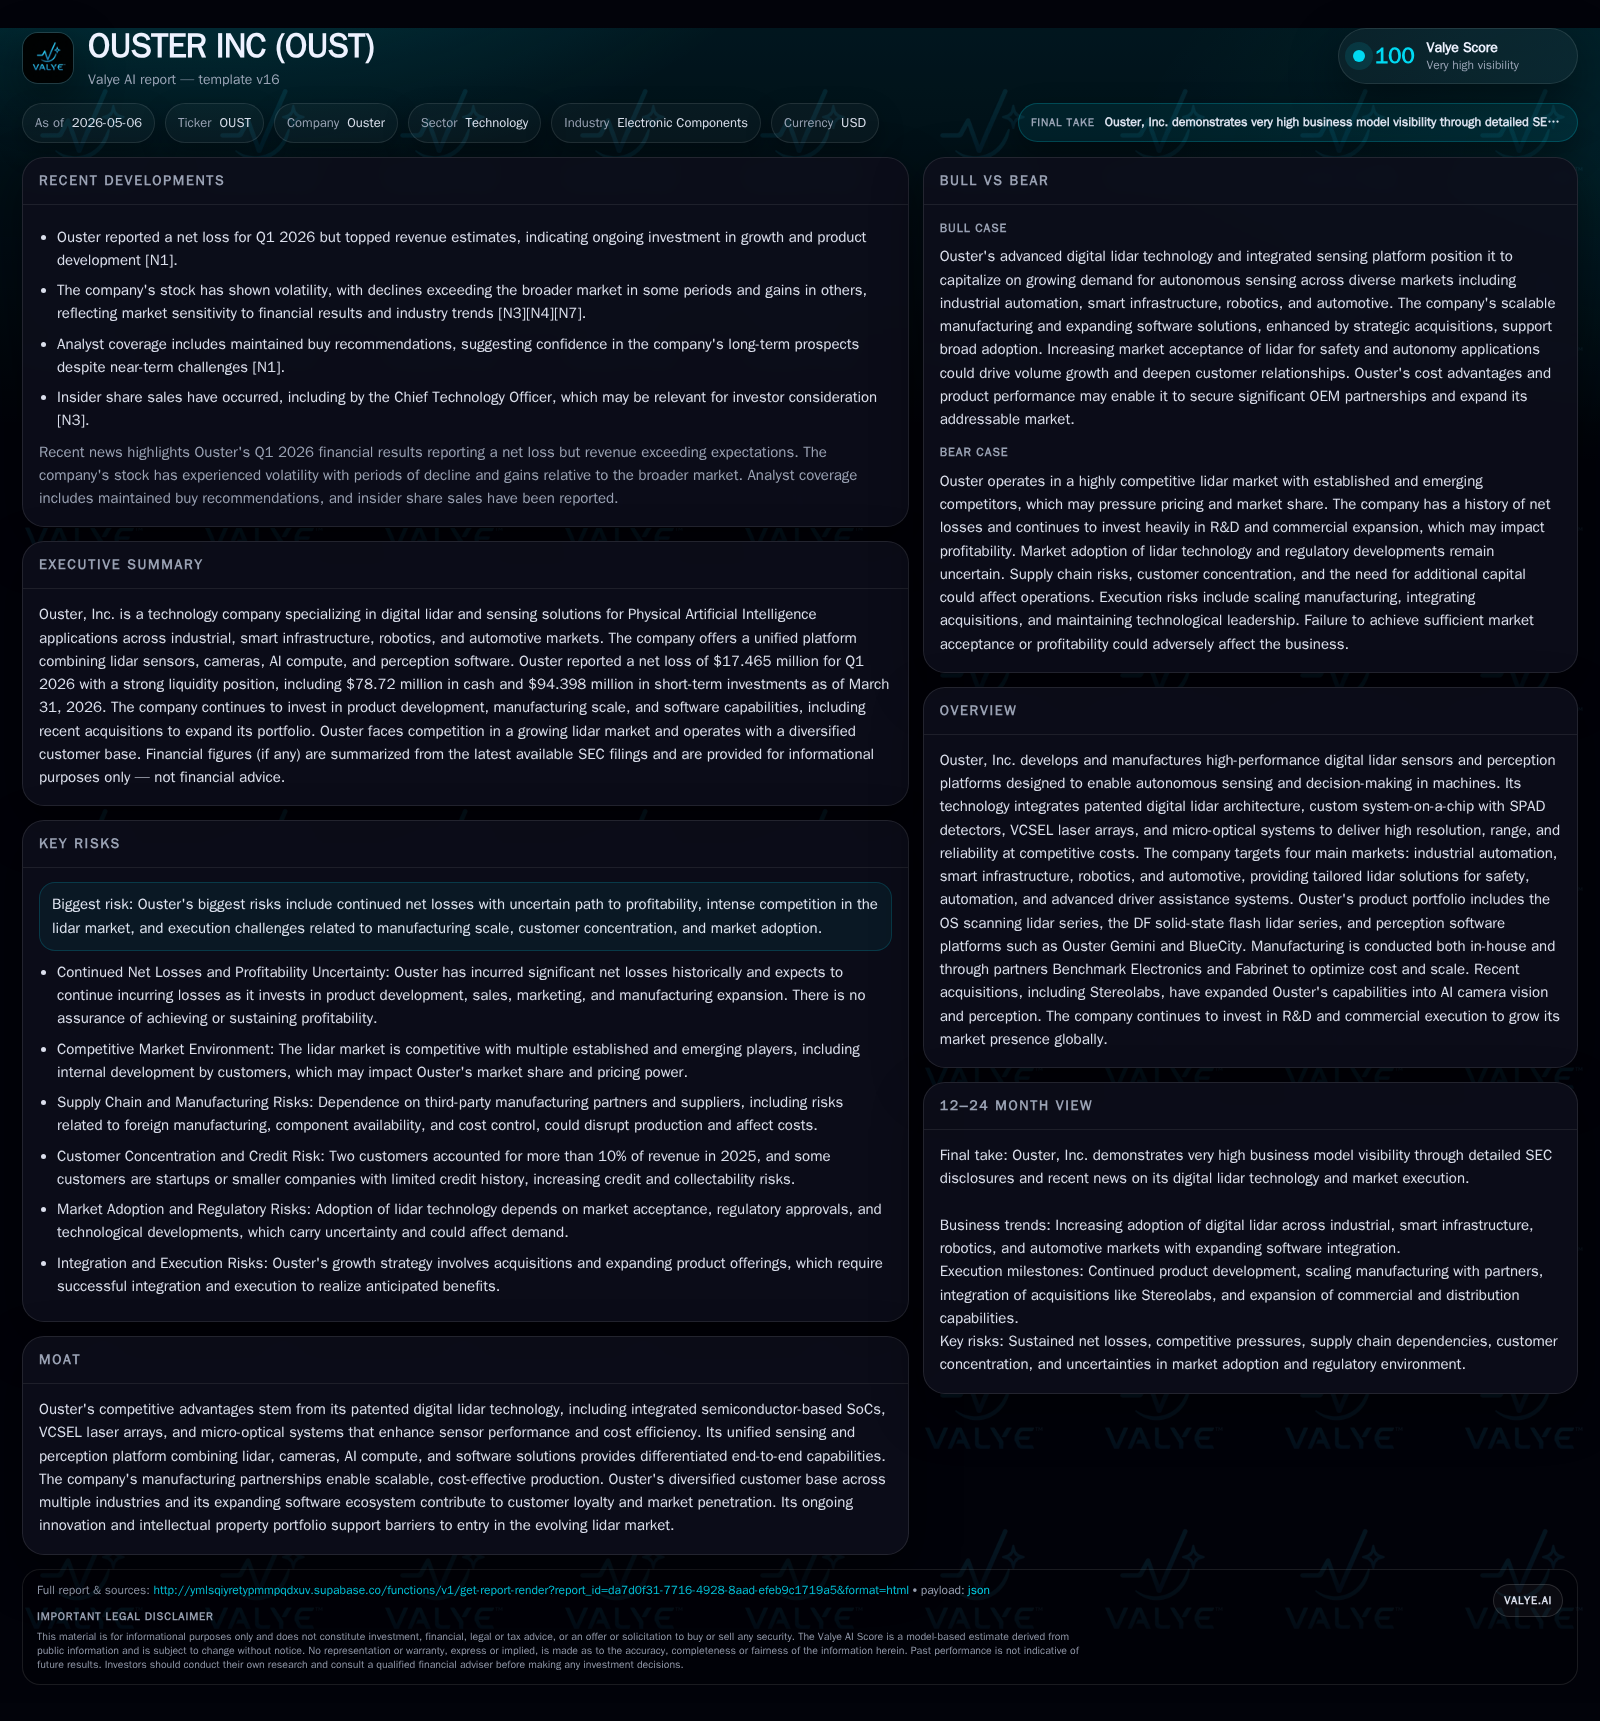
Ouster reported first-quarter 2026 results revealing growth in sensor sales and expanding software capabilities, anchored by its patented digital lidar technology and recent acquisition of Stereolabs. The company continues to focus on four markets—industrial automation, smart infrastructure, robotics, and automotive—with its diversified product portfolio including OS scanning lidars and DF solid-state flash lidars. Despite persistent operating losses, Ouster leverages manufacturing partnerships and a scalable sensor architecture to target volume OEM opportunities. Key risks include execution scale challenges, competitive dynamics in lidar, and regulatory exposures. Near-term milestones include new product launches and commercial ramp efforts in automotive ADAS applications.
Recent Operating Update
Ouster Inc.’s Q1 2026 filing [S2] reveals the company continues to grow revenue beyond market expectations while grappling with substantial net losses. The May 5th quarterly report highlights consistent commercial traction across its four core verticals—industrial automation, smart infrastructure, robotics, and automotive— fueled by incremental adoption of its digital lidar sensors. Notably, ongoing investments expanded through its February acquisition of Stereolabs, which added complementary camera vision technologies and AI compute to Ouster’s Physical AI platform [S12]. While losses persist due to scaling R&D and operations costs (operating income -$74M as of end-2025 [F1]), the company emphasizes strengthening product performance and expanding software ecosystem adoption as critical paths toward profitability.
The contemporaneous 8-K release further details this earnings announcement without material changes to risk factors or liquidity status [S3][S8]. As of March 31, 2026, the cash position rests at approximately $78.7 million with current assets well exceeding liabilities (current ratio ~2.98) signaling operational runway for near-term strategic initiatives [F1]. Manufacturing capacity continues leveraging both proprietary San Francisco facilities and outsourced partners Benchmark Electronics and Fabrinet in Thailand to balance cost efficiency with volume scaling [S14].
Business Model
Ouster is positioned as an innovator in sensing technology specializing in high-performance digital lidar sensors designed to enable autonomous perception capabilities across multiple industries [S25]. Its revenue is primarily generated through the sale of hardware sensors—comprising the OS scanning lidar series catering to various ranges and fields of view—and the DF solid-state flash lidar series focused on reliability, cost competitiveness, and automotive ADAS compliance [S12]. Additionally, Ouster offers perception software platforms including Ouster Gemini (targeting security logistics automation) and BlueCity (intelligent transportation), which unlock higher value from sensor data through AI-driven analytics.
Customers are a mix of direct OEMs and Tier-1 suppliers primarily paying for sensor units supplemented by software subscription or licensing agreements where applicable. Sales pipelines typically progress from initial evaluation to pilot deployments followed by scaled production orders that can increase volumes exponentially for successful integrations [S7]. Pricing power is supported by patented proprietary technologies such as custom semiconductor SoCs incorporating SPAD detectors along with VCSEL laser arrays that enable superior resolution/range at competitive prices relative to legacy analog solutions.
Manufacturing partnerships allow Ouster to reduce capital expenditures while maintaining agility in response to demand fluctuations. The company’s modular product design also enables adaptable configurations tailored to specific end-customer requirements without extensive redesigns—a key differentiator aiding customer retention in complex industrial or automotive ecosystems.
Industry Structure & Competitive Position
The electronic components industry segment encompassing lidar sensors is becoming increasingly competitive with players ranging from legacy incumbents like Velodyne (now merged into Ouster's footprint) to diversified electronics firms OSI Systems [N2] and TE Connectivity [N3], alongside emerging FMCW-focused competitors such as Aeva [N7][N9][N10]. Within this landscape, Ouster seeks differentiation through its fully digital architecture which promises enhanced reliability (low field failure rate) at declining costs thanks to semiconductor integration—a notable structural advantage over hybrid or analog lidar technologies [S14][S25].
Additionally, the bolstering of its sensing platform by integrating camera vision systems via the Stereolabs acquisition aims to capture customers seeking a unified hardware/software solution rather than fragmented sensor suites [S7][S12]. This integrated AI-powered approach aligns with broader industry trends emphasizing multi-modal perception critical for advanced autonomy.
Despite these strengths, market penetration remains challenged by customer adoption cycles typical in high-tech B2B industries where extended pilot phases delay volume ramp-ups. Competitive threats also loom from companies with deeper financial resources or alternative sensing modalities challenging lidar's role in future vehicle designs or industrial automation platforms.
Growth Drivers
Product Roadmap Execution: Continual enhancement of OS scanning lidars powered by next-generation SoCs is expected to improve range/resolution without escalating sensor costs or sizes [S24]. Similarly, the DF solid-state lidars target mass-market OEM automotive programs requiring certification-grade reliability.
Software Adoption: Platforms like Ouster Gemini streamline customers’ ability to transform raw point cloud data into actionable insights reducing engineering overhead; this widening software ecosystem could catalyze broader lidar use where previously technical barriers limited uptake [S19].
Distribution Network Expansion: Beyond direct sales, leveraging global distributor channels inherited post-Velodyne merger facilitates deeper geographic penetration particularly in Asia-Pacific regions where local support boosts customer confidence [S20].
Automotive OEM Engagement: Securing production wins with automakers or Tier-1 suppliers remains high-growth albeit longer-cycle due to strict qualification standards; progress here could lead to volume orders multiplying several folds versus small pilot volumes currently seen [S7].[N1]
Industrial/Retail Robotics & Smart Infrastructure: Increasing demand for autonomous material handling vehicles equipped with reliable sensing systems adds an addressable market guided more by structural digitization trends than cyclical IT spend fluctuations.
Risks & Constraints
Profitability Timeline Uncertainty: Continued sizeable operating losses (-$60M+ net at end-2025) underscore an unproven path towards sustainable profits despite revenue growth momentum [F1][S1]. Cost of goods sold pressures tied to specialized materials or supply chain disruptions may exacerbate margin challenges.
Competitive Pressures: Aggressive innovation cycles among rivals alongside price competition risks commoditization of lidar hardware which could erode pricing power unless differentiated system-level advantages are maintained.
Supply Chain Dependencies: Outsourcing manufacturing introduces risks relating to geopolitical tensions especially considering operations in Thailand plus compliance requirements such as Buy America certifications impacting flexibility [S14][S18].
Customer Concentration: Two customers accounted for over 10% revenue each in 2025 highlighting potential vulnerability if major programs delay or cancel orders [S24].
Regulatory & Legal Environment: LiDAR products face evolving regulations related to product emissions standards under FDA oversight due to laser components; AI tech used internally is subject to fast-changing international policies potentially increasing compliance costs or limiting functionalities [S16][S17]. The risk of costly IP litigation either defending or asserting patent rights remains salient amid crowded patent landscapes [S27].
Management & Execution Risks: Scaling sales pipelines efficiently alongside integrating newly acquired technologies (e.g., camera vision post-Stereolabs) requires cohesive cross-functional execution amid intense sector innovation cycles [S19].
What To Watch Next
- Release schedules for next-gen OS series SoC upgrades demonstrating tangible performance enhancements without cost inflation.
- Progress reports on commercialization traction for DF solid-state lidars within automotive Tier-1/OEM ecosystems including signings or pilot expansions.
- Software platform adoption rates reflected through new contracts or incremental sensor volumes attributed directly to bundled perception solutions like BlueCity.
- Expansion milestones related to distribution partnerships especially targeting Asia-Pacific markets.
- Liquidity trends based on quarterly cash burn rates against cash reserves given absence of disclosed new financing events since last filings.
- Regulatory developments impacting electronic product compliance particularly any FDA rulings around laser safety affecting product certification timelines.
Financial Profile Snapshot
Latest financial snapshot
| Metric | Value | Period |
|---|---|---|
| Cash & equivalents | $79mm | |
| 2026-03-31 | ||
| Current assets | $251mm | |
| 2026-03-31 | ||
| Current liabilities | $84mm | |
| 2026-03-31 | ||
| Current ratio | 2.98x | |
| 2026-03-31 |
Source: SEC companyfacts cache [F1].
| Metric | Value | Period End |
|---|---|---|
| Cash & Equivalents | $78.7 million | |
| 2026-03-31 | ||
| Total Debt | $40 million* | |
| 2023-09-30* | ||
| Current Assets | $251 million | |
| 2026-03-31 | ||
| Current Liabilities | $84.3 million | |
| 2026-03-31 | ||
| Current Ratio | 2.98 | |
| 2026-03-31 | ||
| Operating Income | -$73.9 million | |
| 2025-12-31 | ||
| Net Income | -$60.4 million | |
| 2025-12-31 |
*Total debt figure is best-effort latest available from Q3 2023 data; no newer explicit debt disclosures were provided [F1].
Liquidity metrics indicate sufficient short-term coverage while annual losses highlight need for sustained investment capital or improved operational leverage before profitability optimization.
This analysis synthesizes publicly available regulatory filings alongside market news without making investment recommendations. The content strictly adheres to confirmed data points without extrapolation beyond documented sources.
Disclaimer: This is research-only, informational analysis and not investment advice. It may include AI-generated interpretation and general industry context. Always verify important details using primary sources.
Comments