
Blue Owl Capital’s Strategic Acquisitions and Permanent Capital Drive Revenue Growth Amid Profit Margin Pressure
AUM diversification and structured capital bases underpin growth while net income contracts as expenses rise.
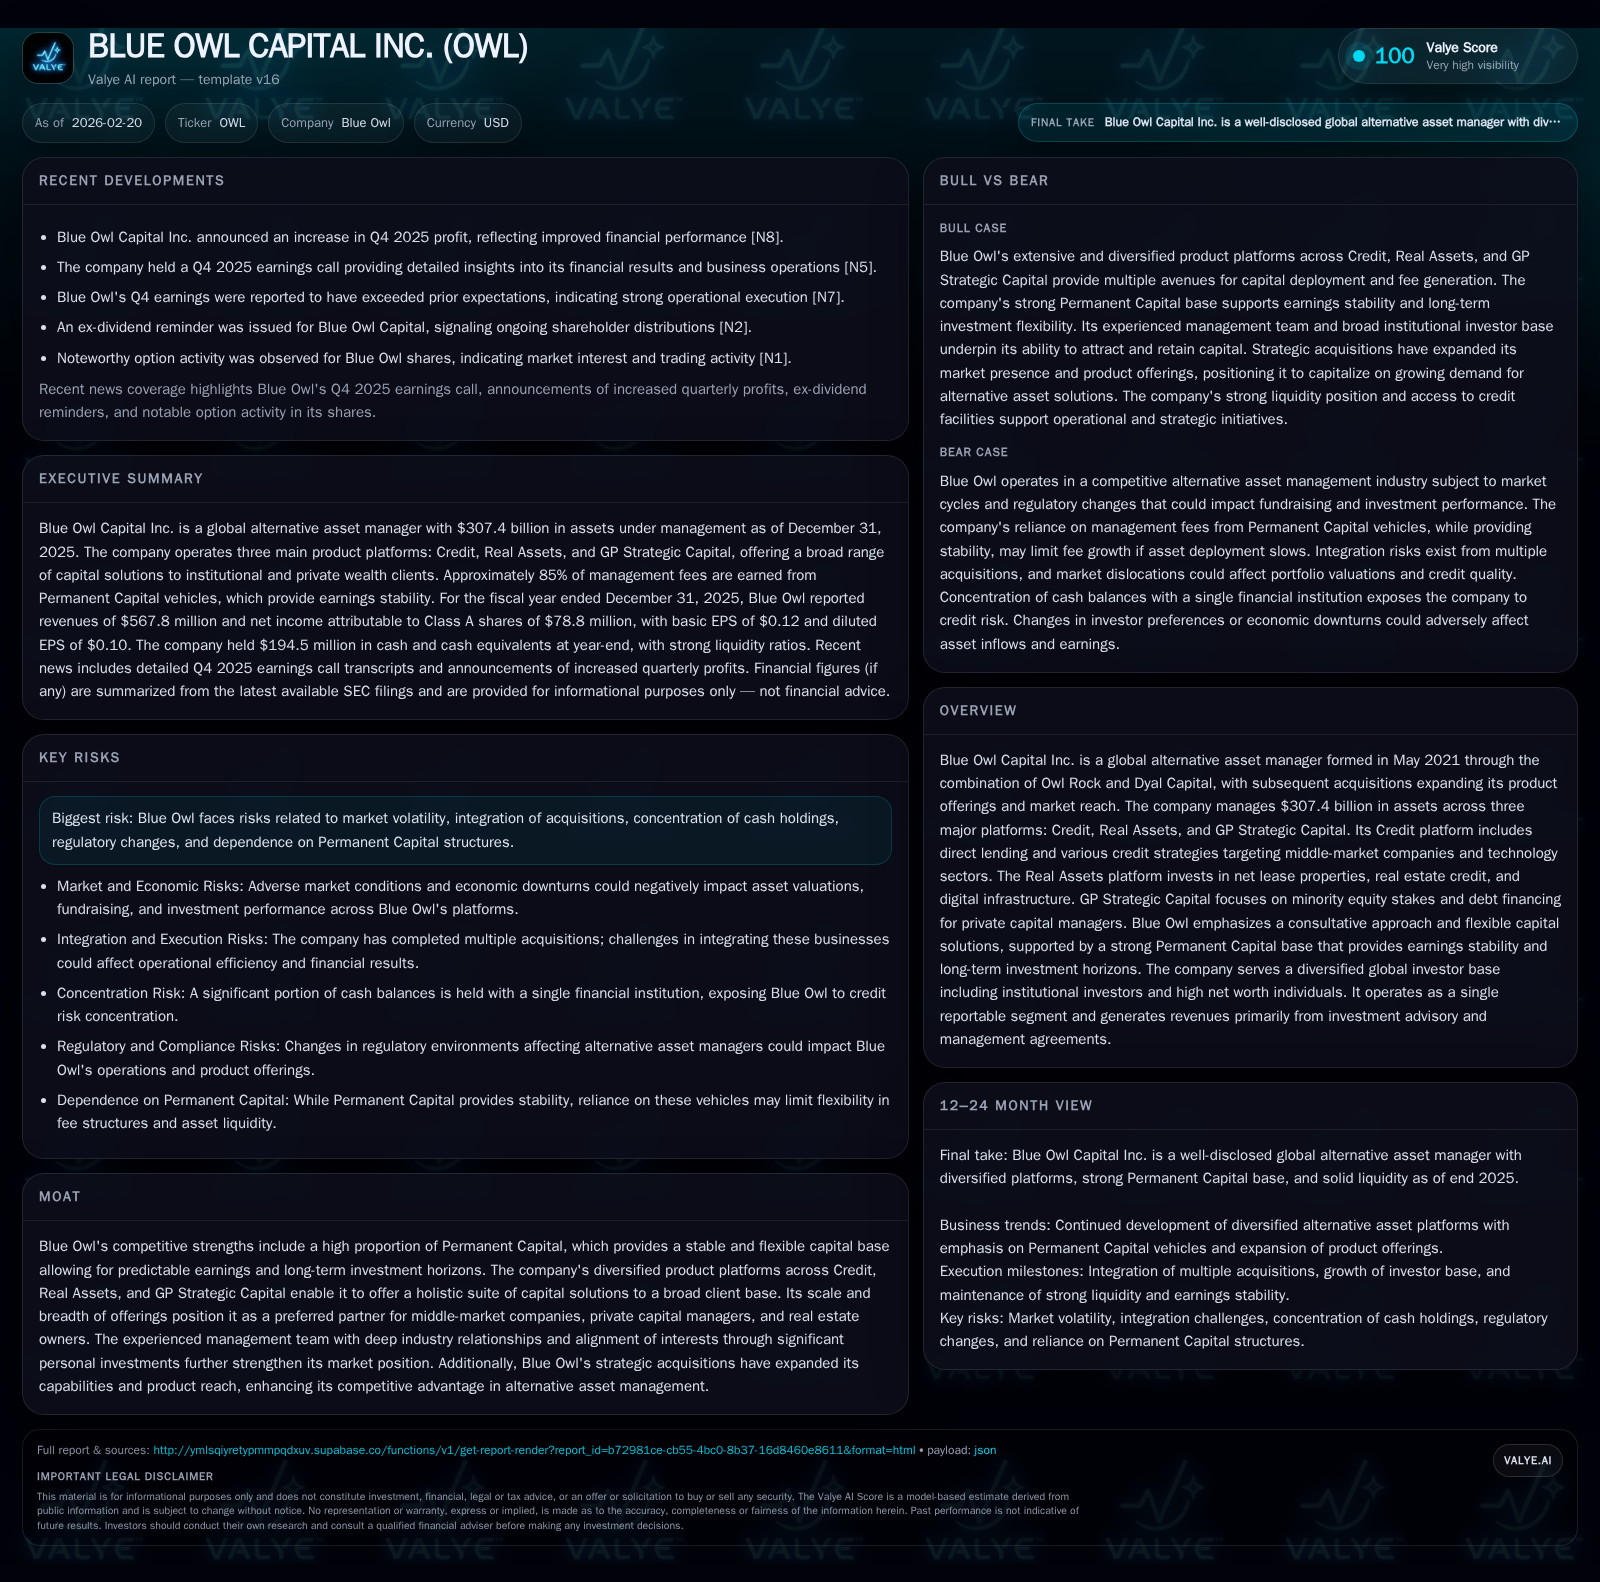
Blue Owl Capital Inc. (OWL) has built its platform through pivotal acquisitions since its 2021 formation, expanding across Credit, Real Assets, and GP Strategic Capital. The company achieved a 7.6% revenue increase for FY 2025 driven by fee growth in permanent capital vehicles, yet net income declined by 28.1% year-over-year due to elevated operating costs and integration expenses. Blue Owl maintains a robust liquidity profile with over $194 million in cash and a large revolving credit facility, supporting strategic investments and share repurchases. The firm’s capital allocation emphasizes growing dividends and opportunistic buybacks, underpinned by stable management fees from long-dated products that represent roughly 85% of its fee base.
Company Overview and Historical Context
Blue Owl Capital Inc., formed in May 2021 via the merger of direct lending leader Owl Rock and private capital solutions provider Dyal Capital, has rapidly scaled into a global alternative asset manager overseeing $307.4 billion in assets as of December 31, 2025 [S1][F1]. It operates through three primary platforms: Credit (including middle-market direct lending and syndicated loans), Real Assets (net lease real estate, real estate credit, digital infrastructure), and GP Strategic Capital (minority stakes & debt financing for private fund managers).
Strategic acquisitions have been core to Blue Owl's expansion strategy: Oak Street (real estate) acquired December 2021; Wellfleet (leveraged loan CLOs) April 2022; Par Four CLO Management August 2023; CHI healthcare equity December 2023; Prima real estate lending June 2024; Kuvare insurance asset management July 2024; Atalaya credit-focused products September 2024; IPI digital infrastructure January 2025 [S1][S14]. This diversified product offering is supported by a strong Permanent Capital base that provides long-term investment horizons and earnings predictability.
Historical Financial Performance
Blue Owl has demonstrated resilient top-line growth during ongoing investments in platform scale:
Historical performance (annual)
| FY | Rev ($mm) | Net ($mm) | CFO ($mm) | Capex ($mm) | Rev YoY | Net YoY |
|---|---|---|---|---|---|---|
| 2025 | 568 | 79 | 1256 | 58 | +7.6% | -28.1% |
| 2024 | 528 | 110 | 1000 | 64 | +101.7% | |
| 2023 | 54 | 949 | 68 | +685.0% | ||
| 2022 | -9 | 728 | 66 |
Note: Omitted columns lack sufficient annual XBRL coverage in the provided tags (need ≥2 annual points): OpInc, Div. Source: SEC companyfacts cache [F1].
Capital returns and efficiency (annual)
| FY | Buybacks ($mm) | FCF ($mm) | ROE% |
|---|---|---|---|
| 2025 | 54 | 1198 | 3.6 |
| 2024 | 0 | 935 | 5.2 |
| 2023 | 0 | 881 | 3.6 |
| 2022 | 79 | 663 | -0.6 |
Source: SEC companyfacts cache [F1].
Note: Dividends figures are incomplete for some years due to data limitations; buyback data is from SEC filings [F1].
While revenues increased steadily at a mid-single-digit pace driven by management fee improvements across all business segments (Credit platform revenues totaled approximately $1.75 billion gross including fees on third party-managed products), net income contracted materially in FY25 compared to the prior year [S17][S18]. This divergence primarily reflects heightened operating expenses including amortization of acquisition-related incentives, integration costs from recent acquisitions, and elevated incentive compensation [N1][S3]. Despite lower net income, operating cash flow surged by more than one-quarter to roughly $1.26 billion due to improved collections and strong underlying operational scale.
Capital expenditures remain modest relative to cash flow at ~$58 million annually focused on technology systems upgrades and fixed assets supporting product expansion [F1][S18].
Platform-Specific Drivers and Growth Outlook
Credit Platform
Blue Owl’s Credit segment continues to anchor performance with direct lending at the core serving middle-market companies backed by sizeable Permanent Capital vehicles assuring consistent fee revenue streams [S15][S24]. Expansions into alternative credit niches—specialty finance and private corporate credit—and investment grade credit further diversify revenue sources.
With investments like Atalaya acquisition broadening liquid credit strategies encompassing CLOs and broadly syndicated loans plus Wellfleet acquisition focused on leveraging CLO product suites, Blue Owl positions itself uniquely versus peers relying heavily on capital-intensive fund structures [S15][S24].
Real Assets Platform
Growth here is propelled by Oak Street’s net lease real estate portfolio fortified by subsequent acquisitions such as Prima (real estate finance) and IPI (digital infrastructure). The platform strategically targets resilient tenants and long-duration net leases insulated from e-commerce disruption combined with digital infrastructure assets aligned with hyperscalers demand drivers [S25]. This multi-pronged approach offers attractive yield profiles with downside protection via conservative underwriting.
GP Strategic Capital Platform
This segment leverages Blue Owl’s dominant position acquiring minority equity stakes or providing customized debt capital solutions to leading private equity managers globally [S16][S24]. Their flagship fundraises have outpaced peers substantially indicating scalability of this model.
Recent healthcare equity expansions (CHI) illustrate sector specialization potential enhancing both earnings diversity and client reach.
Forecasts and Milestones to Monitor
Explicit guidance for fiscal years beyond end-2025 is not provided but several areas warrant watch:
- Distributable Earnings trajectory given integration expense normalization could improve net income margins [N1]
- Progress on milestone revenue targets from recent acquisitions including digital infrastructure initiatives through IPI partners [N3]
- Expansion or amendments on revolving credit facility enabling deal pipeline financing [S8][S22]
- Dividend increases aligned with Board’s stated annual uplift target near inflationary levels [S7]
- Successful execution of the ongoing share repurchase program capped at $150 million authorized through February 28, 2027 [S23]
Monitoring these will help clarify medium-term earnings sustainability versus short-term margin pressure.
Returns & Capital Allocation Strategy
Blue Owl displays capital discipline balancing shareholder returns with growth investments:
- ROE is modest at approximately 3.6%, constrained partly by high equity balances post-acquisitions but expected to improve as earnings stabilize [F1].
- Operating cash flows exceed capex significantly yielding strong free cash flow (~$1.2B), which fuels dividends, repurchases, acquisition earnouts payments and further strategic investments [F1].
- Dividends grew annually reaching an actual payout near $0.90 per Class A share for FY25 with plans for incremental increases reflecting expected distributable earnings growth [S10][S19].
- Share repurchases restarted aggressively in late FY25 totaling approximately $54 million after a hiatus during prior years showing confidence given current valuation levels and liquidity cushions [S23].
- Debt maturity ladder well structured with senior notes staggered through mid-century dates accompanied by increased revolver capacity providing flexibility for future deployment or repayment actions [S22].
This balanced capital allocation framework benefits from a stable base via Permanent Capital fees (~85% of management fees), aligning incentives towards durable distribution capacity rather than short-term volatility dependence [S1].
Strategic Strengths & Risks
Competitive Advantages:
- High proportion of Permanent Capital vehicles grants earnings visibility unusual among alt asset managers.
- Diversified platform spread mitigates concentration risk while cross-selling opportunities support client retention.
- Scale enables broader market access especially in middle-market corporate lending where competitive intensity remains elevated yet fragmented.
- Seasoned leadership team maintains deep industry relationships aiding origination across verticals.
- Acquisitions accretive over medium term expand capabilities into fast-growing sectors such as digital infrastructure and healthcare equity investments.
Primary Risks:
- Market turbulence could pressure valuations within alternative assets affecting performance fees realization.
- Integration complexities pose near-term margin compression risks.
- Regulatory changes impacting structure or tax terms on Permanent Capital products may alter economics.
- Concentration risks stemming from material exposure to particular credit portfolios or major tenants within Real Assets.
- Dependence on continual capital raising for long-dated funds carries fundraising cycle risk particularly if interest rate environments evolve unexpectedly.
Conclusion
Blue Owl Capital exemplifies a modern alternative asset manager building scale through strategic M&A supplemented by an extensive Permanent Capital base fostering steady fee generation. Its diversified multi-platform approach spanning Credit solutions to Real Assets net lease portfolios along with GP Strategic minority investments positions it competitively within evolving investor appetite frameworks favoring yield nestled within alternatives.
Revenue growth remains healthy reflected in continued fee expansion though profitability faces headwinds from acquisition-related expenses restricting net income gains currently—an expected transition phase post rapid buildout period needs close monitoring going forward. Liquidity reserves alongside an expanded revolving credit facility provide ample operational runway while capital return policies underline management confidence amid prevailing macro uncertainties. Investors following Blue Owl should focus on integration milestones post-acquisition cycles alongside trajectories of distributable earnings supporting sustained dividend growth as indicators of durable value creation potential amidst competitive pressures inherent in the alternative asset landscape.
This analysis is intended solely for informational purposes based on publicly available financial disclosures and recent news transcripts without any investment recommendations.
Disclaimer: This is research-only, informational analysis and not investment advice. It may include AI-generated interpretation and general industry context. Always verify important details using primary sources.
Comments