
Oxford Industries' FY2025 Sharp Earnings Decline Underscores Apparel Sector Headwinds
In FY2025, Oxford Industries saw a significant drop in profitability despite stable revenues amid intensifying macroeconomic and industry pressures.
Oxford Industries Inc. reported a net loss in fiscal year 2025, reflecting a marked deterioration from prior years when profitability was solid. Though revenue improved modestly, operating losses and rising costs from inflation, supply chain disruption, and competitive pricing pressure weighed heavily on the bottom line. The company’s operating cash flow remained positive with measured capex reductions, but its equity base declined due to losses. Capital returns continued through dividends and share repurchases despite financial stress. Looking forward, Oxford signals cautious optimism but must navigate ongoing economic uncertainties impacting discretionary apparel spending.
Historical Performance Highlights
Oxford Industries has experienced oscillating financial performance over recent fiscal years. According to SEC filings through January 31, 2026 [F1], revenue reached $293.2 million for FY2025—a roughly 12% increase compared to the prior comparable period [F1]. Despite top-line growth, operating income deteriorated drastically from $119 million in FY2024 to a loss of $31.3 million in FY2025; corresponding net income followed the same trend moving from a profit of about $92.9 million to a net loss near $27.9 million [F1]. These declines primarily reflect intensified margin pressures stemming from inflationary input cost rises and increased promotional discounting across the apparel sector highlighted in risk disclosures [S1][S4][S7].
Operating cash flow remains robust at approximately $119.6 million for FY2025 despite earnings pressures indicating effective working capital controls and cash collection efforts amid volatile conditions [F1]. Capital expenditure in contrast was scaled back by nearly 20%, amounting to $108.3 million as Oxford recalibrated investment spending reflecting cautious outlooks [F1]. The company’s equity base contracted to roughly $514.8 million at fiscal year-end due to losses booked during the year [F1]. Importantly, current assets stood at over $292 million against current liabilities of approximately $265 million yielding a modest current ratio around 1.1x—adequate short-term liquidity [F1]. Cash reserves were reported at around $8.1 million providing additional operational buffer albeit limited relative to liabilities [F1].
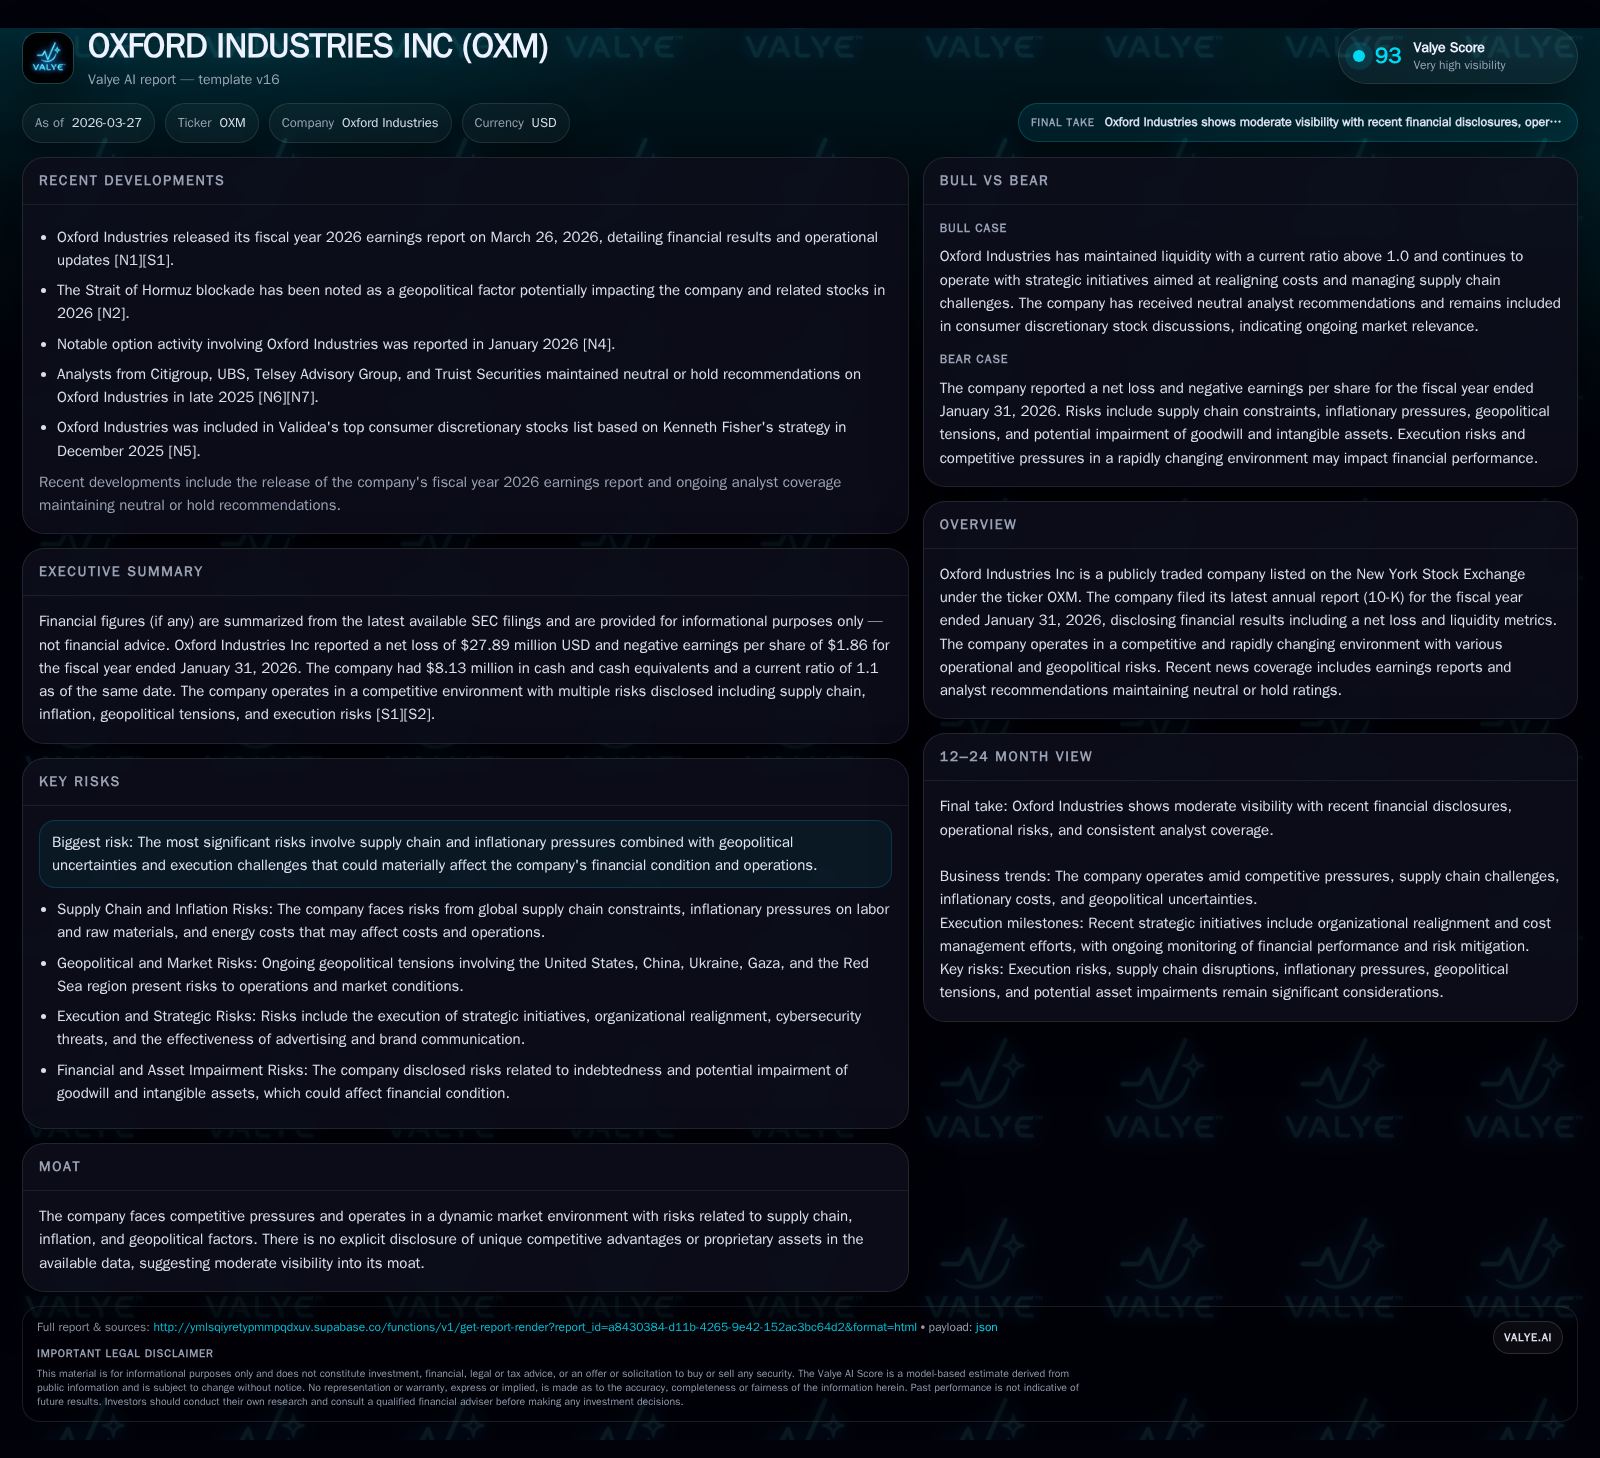
Historical performance (annual)
| FY | Net ($mm) | CFO ($mm) | OpInc ($mm) | Capex ($mm) | Net YoY |
|---|---|---|---|---|---|
| 2025 | -28 | 120 | -31 | 108 | -130.0% |
| 2024 | 93 | 194 | 119 | 134 | +53.2% |
| 2023 | 61 | 244 | 81 | 74 | -63.4% |
| 2022 | 166 | 126 | 219 | 47 |
Source: SEC companyfacts cache [F1].
Capital returns and efficiency (annual)
| FY | Div ($mm) | Buybacks ($mm) | FCF ($mm) |
|---|---|---|---|
| 2025 | 42 | 55 | 11 |
| 2024 | 43 | 0 | 60 |
| 2023 | 42 | 20 | 170 |
| 2022 | 35 | 92 | 79 |
Source: SEC companyfacts cache [F1].
Table: Oxford Industries annual financial highlights (rounded)
Business Model & Industry Context
Oxford Industries operates principally through four distinct lifestyle apparel brands: Tommy Bahama, Lilly Pulitzer, Johnny Was, and emerging labels aimed at broadening consumer engagement across direct-to-consumer (DTC), wholesale, and licensing channels [S1]. This brand-centric structure allows flexibility in resource allocation tailored by customer segment and distribution strategy.
The apparel industry environment continues to be highly competitive and cyclical with discretionary consumer spending trends strongly influencing sales dynamics [S1]. Rising inflation and prolonged geopolitical uncertainties such as US-China trade tensions and conflicts impacting energy markets have escalated input costs and disrupted global supply chains affecting cost structures for sourcing raw materials and manufacturing operations [S1][S7]. Furthermore, consumers are shifting discretionary spend toward services relative to goods like apparel—pressuring traditional retail demand especially when combined with increasing promotional activity among competitors seeking foot traffic [S1][N3]. The growth of digital commerce also imposes new operational complexities including demands for personalization and rapid fulfillment increasing overhead.
Forward-Looking Perspectives & Operational Initiatives
Oxford acknowledges persistent macroeconomic unpredictability that could constrain consumer spending further while elevating operational risks related to tariffs, inflationary wage pressures particularly in retail store staffing/benefits, energy costs, and fluctuating transportation fees affecting supply chain resilience [S1][S7][S8]. The company reports undertaking organizational realignment initiatives targeting Johnny Was specifically aiming at cost efficiencies alongside deeper technology integration investments designed to enhance omnichannel capabilities serving evolving shopper expectations [S6][S7].
While no explicit forward financial guidance was reiterated beyond existing disclosures up until January 2026 [N1][S18], management emphasizes a cautious but constructive outlook noting performance trends through recent selling seasons align with earlier low-end guidance assumptions shared December 2025 [S20]. Close attention will be warranted on comparable sales metrics particularly full-price retail plus e-commerce which exclude lower-margin outlet activity illustrating true brand health within seasonal fluctuations [S1].
Returns & Capital Allocation
Oxford has preserved shareholder returns through steady dividend distributions near the $42-43 million annual range despite earnings volatility evident in FY2025 loss results [F1]. The resumption of share repurchases totaling over $55 million after a pause in FY2024 reflects management’s commitment to capital discipline balanced against liquidity constraints given current debt levels disclosed alongside cash reserves around $8 million at end-FY25 [F1][S9][S10][S11]. Capital expenditures remain significant though moderated compared to prior years suggesting maintenance investments prioritized amid volatile business conditions.
The approximate return on equity calculation for FY2025 is negative around -5%, consistent with the reported net loss eroding shareholder equity during the year [F1]. Given this backdrop, Oxford faces a balancing act between supporting its brand portfolio investment while navigating profitability recovery amid broader apparel industry cycles.
Summary & Considerations Going Forward
Oxford Industries exemplifies many apparel sector challenges facing mid-sized lifestyle brands today: moderate revenue growth offset by squeezed margins via inflationary cost spikes and aggressive competitive discounting erosions culminated in an operating loss reversal for FY2025. Its proactive steps include cost realignment plans and tech-enabled omnichannel enhancements critical for sustaining relevance as consumer behaviors rapidly evolve.
Key near-term monitors include:
- Comparable sales data segmented by channel for signs of rebound or further softness,
- Progress on organizational restructuring impacts including Johnny Was operations,
- Inflation trajectory effects on labor costs and input pricing pass-through efficacy,
- Liquidity status given cash flow dependency amid ongoing capex needs,
- Shareholder return policy balance amidst earnings recovery strategies.
Given global macro uncertainties — ranging from geopolitical conflicts impacting energy/supply chains to shifts in discretionary consumer budgets — Oxford’s resilience will hinge greatly on execution effectiveness across these strategic dimensions.
This analysis is grounded solely on publicly available SEC filings up through March 27, 2026 ([F1],[S1]-[S20]) and relevant news reports ([N1]-[N3]). It does not incorporate private information or provide investment advice but aims to offer an informed view of Oxford Industries’ recent financial performance, strategic challenges, and operational outlook within the context of its apparel industry environment.
Disclaimer: This is research-only, informational analysis and not investment advice. It may include AI-generated interpretation and general industry context. Always verify important details using primary sources.
Comments