
Penske Automotive Advances Through Strategic Acquisitions and Regulatory Challenges in Q1 2026
Penske Automotive delivered strong first-quarter results supported by acquisition-driven expansion and heightened regulatory compliance demands.
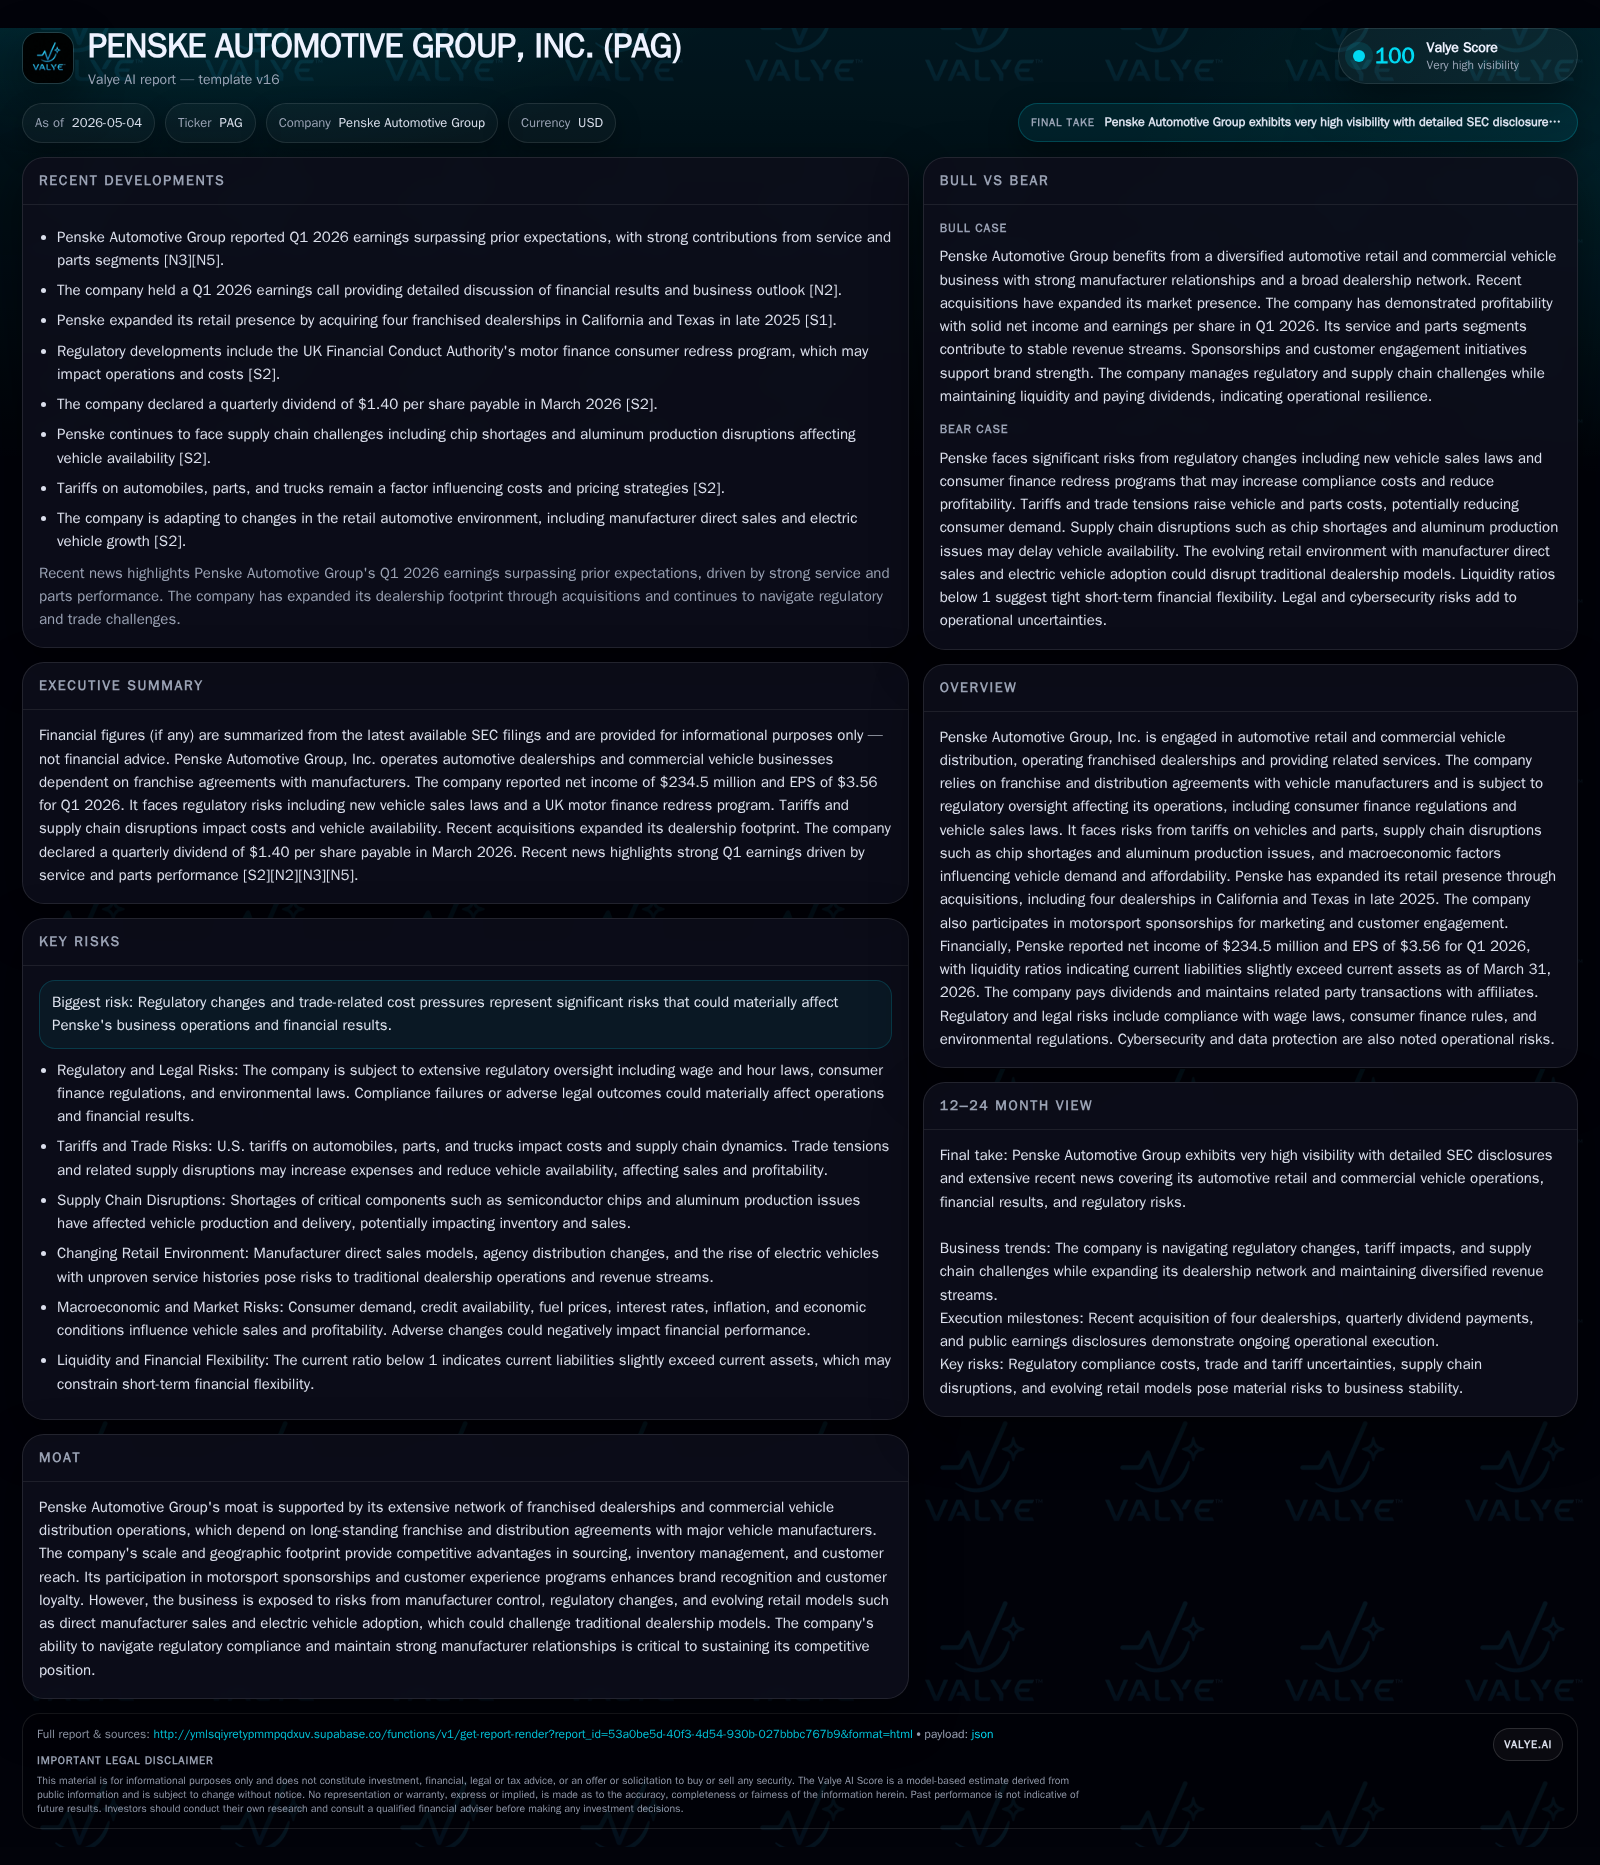
In Q1 2026, Penske Automotive Group reported solid earnings with net income of $234.5 million and EPS of $3.56, reflecting resilience amid evolving regulatory pressures in automotive finance and trade tariffs. The company expanded its footprint via acquisitions of four new dealerships in California and Texas, strengthening its presence in key U.S. markets. Penske's diversified business model, spanning franchised vehicle retailing and commercial truck distribution across multiple geographies, leverages scale, brand partnerships, and service offerings to generate sustainable revenue streams. Regulatory risks remain prominent, particularly in the U.K.’s consumer finance sector and U.S. tariff policies affecting vehicle costs. Penske’s growth trajectory hinges on effective integration of acquisitions, navigating regulatory complexity, and capitalizing on aftermarket service demand.
Recent Operating Update: Q1 2026 Performance Highlights
Penske Automotive Group’s most recent quarterly filing dated April 30, 2026 (10-Q) outlines steady operating performance with net income of $234.5 million and EPS of $3.56 for Q1 2026 [S2][S3]. These results reflect continued strength in both its automotive retail divisions and commercial truck operations despite a challenging macroeconomic and regulatory backdrop. Liquidity remains sound with cash balances near $83.7 million at quarter-end against current liabilities slightly higher than current assets (current ratio 0.96) signaling working capital pressures typical in retail inventory-heavy businesses but well managed through floor plan financing structures [F1][S2].
A notable operating development includes the strategic acquisition during late 2025 of four dealerships located in key growth markets—California and Texas—including Longo Toyota, the largest Toyota dealership in the United States—a transaction completed under common control accounting [S1][N2]. This expanded Penske's foothold in high-volume premium segments within these states.
Additionally, Penske reaffirmed no changes in director or officer trading plans under SEC Rule 10b5-1 during the quarter indicating stable insider activity [S2].
Business Model Overview
Penske operates an extensive network comprising over 365 franchised automotive dealerships worldwide primarily located across the U.S., U.K., Canada, Germany, Italy, Japan, Australia, New Zealand, and parts of the Pacific region [S1]. It is one of world's leading automotive retailers by revenue. The core business delivers revenue from:
- New vehicle sales: Over 583,000 new and used vehicles retailed or wholesaled in 2025.
- Used vehicle dealerships: Including U.S.-based CarShop locations and Sytner Select dealerships in the UK.
- Aftersales service: Maintenance & repair services which yield higher margins than vehicle sales.
- Finance & insurance (F&I) products: Third-party brokerage of auto financing arrangements enhances profitability.
- Collision repair services: Adding local ecosystem stickiness.
- Commercial truck retailing: Under Premier Truck Group (PTG) mainly serving Freightliner brands.
- Commercial vehicle distribution: Principally via Penske Australia distributing Western Star trucks and others.
The company derives most revenues from franchise agreements with original equipment manufacturers (OEMs) that define dealer rights but also impose operational constraints typical to the industry—such as inventory sourcing from manufacturers and stringent compliance standards [S1]. The premium brand mix (71% of automotive dealership revenues from brands like Audi, BMW, Lexus) supports stronger pricing power compared to volume brands.
Vehicle sales are cyclical but the broader aftersales services and F&I businesses help stabilize margins given their recurring nature [S1]. Moreover, Penske is involved in agency sales models where it earns fees without inventory holdings—a growing channel especially outside the U.S.—shifting some margin profiles but expanding volume potential [S1].
Recent acquisitions have been focused on strengthening geographic coverage as well as adding luxury brand franchises (e.g., Ferrari dealership acquired in Italy; BYD franchise opened in Germany) as part of diversification toward electric vehicles (EVs) amid regulatory shifts favoring low-emission vehicles.
Industry Structure and Competitive Positioning
Automotive retail combines highly competitive brand representation battles among dealers competing for OEM franchises alongside tight manufacturer control over dealer network size, location exclusivity, warranty work allocations, and inventory financing terms.
Penske's moat is anchored by:
- Scale & Geographic Footprint: Offering access to a broad customer base globally provides leverage in manufacturer negotiations for allocations (especially critical when constrained by chip shortages).
- Diversified Brand Portfolio & Premium Focus: Dominance in luxury segments confers better margins versus volume-focused peers.
- Service Ecosystem Development: Aftersales revenues buffer against new vehicle sale cyclicality while enhancing customer loyalty through service contracts.
- Commercial Vehicle Segment Presence: PTG’s specialization offers complementary exposure to heavy truck demand beyond passenger vehicles.
- Motorsport Sponsorships & Marketing: Motorsport involvement boosts brand equity especially among performance-oriented customers.
However, key competition arises not only from other large dealership groups like Sonic Automotive or AutoNation but also from evolving industry dynamics including direct manufacturer-to-consumer sales models enabled by companies like Tesla—which threaten traditional franchise dealer models—and increasing regulatory oversight that complicates dealer business operations.
Growth Drivers
Acquisitions & Geographic Expansion
Penske actively pursues acquisitions to bolster its presence in strategic geography-brand clusters with recent examples being:
- Acquisition of four dealerships in California and Texas late 2025 including largest Toyota franchise Longo Toyota
- Purchases in Europe targeting high-growth EV brands such as BYD Such consolidation extends network density enhancing buying scale plus cross-selling opportunities within integrated dealer groups.
Aftersales & Services Penetration
Higher margin growth lies in maintenance services that benefit from growing installed base vehicles rather than just cyclical new unit deliveries. The company continues expanding service bays capacity along with third-party insurance/F&I product placements that raise wallet share per customer visit.
EV Market & Regulatory Adaptation
Penske faces regulatory variation globally - e.g., U.S. elimination of $7,500 EV tax credit dampened EV demand while UK's mandate requiring 33% EV sales creates inevitability for electrification investments domestically [S1]. Successful adaptation to this divergent landscape will determine market share trends moving forward as customers shift preferences towards zero emission vehicles affecting brand portfolio valuations.
Commercial Truck Distribution Expansion
With stricter emissions standards impending on heavy-duty vehicles starting model year 2027 [S1], Penske’s PTG segment must navigate technology transitions while leveraging strong OEM partnerships to serve commercial fleets needing upgraded equipment aligned with compliance needs.
Risks & Watchpoints
Regulatory Complexity & Compliance Costs
The Financial Conduct Authority’s motor finance redress program issued March 30th requires lenders to compensate affected customers related to undisclosed dealer commissions amid practices deemed unfair by regulators [S10][S20]. Although lenders bear primary responsibility for payouts, dealers like Penske must support implementation documentation; there remains risk that lenders may seek to recoup costs via dealer commissions reduction raising operating expenses indirectly. Additionally newly adopted state laws such as California's "Combating Auto Retail Scams Act" enforce greater transparency on pricing disclosures while introducing return rights increasing transaction management complexity [S21]. Rising regulatory burdens necessitate investments into compliance infrastructure adding fixed costs against competitive pressure to maintain pricing competitiveness.
Tariff Impact & Supply Chain Disruptions
Continued tariffs imposed on automobiles and parts by the U.S., combined with chip shortages affecting electronic component availability remain headwinds complicating inventory management with upward pressure on prices affecting affordability for consumers [S10][S21]. Uncertainty around future trade policy evolutions constitutes an ongoing operational risk factor influencing purchasing behaviors.
Shift Toward Direct-to-Consumer Sales Models
Manufacturers increasingly selling vehicles directly online bypassing traditional dealership franchise networks undermine exclusivity previously enjoyed; adoption rates vary but structural threat persists which could erode stock turn metrics if competitor direct models gain traction rapidly.
EV Adoption Timing Variability
Disparate regional EV policy enforcement means adoption rates vary geographically creating inventory planning complexity. Pricing premiums for EVs can deter mass-market uptake absent incentives impacting volume forecasts。
What To Watch Next
- Execution progress integrating recent acquisitions fully into existing operational frameworks ensuring anticipated revenue synergies materialize.
- Early impact assessments following implementation starting June 30th of FCA consumer redress program related administrative duties on dealer financials.
- Developments responding to federal/state-level trade policy updates potentially altering tariff structures affecting supply chains costs.
- Trends in aftersales revenue growth metrics signaling offsetting resilience vs new car sales volatility given macroeconomic pressure points.
- Introduction or expansion of EV franchises across more regions tracking market acceptance pace tied to government regulation shifts.
- Updates on litigation or class actions tied to compliance issues or consumer finance practices potentially influencing reputation or risk exposure profiles.
Financial Profile Summary
Latest financial snapshot
| Metric | Value | Period |
|---|---|---|
| Cash & equivalents | $84mm | |
| 2026-03-31 | ||
| Current assets | $6.3bn | |
| 2026-03-31 | ||
| Current liabilities | $6.6bn | |
| 2026-03-31 | ||
| Current ratio | 0.96x | |
| 2026-03-31 |
Source: SEC companyfacts cache [F1].
As of fiscal Q1 ending March 31st, 2026: Cash & equivalents stood at approximately $83.7 million against current liabilities exceeding current assets resulting in a modest current ratio near 0.96 reflecting tight working capital dynamics common in inventory-rich retail operations; total debt figures stand at approximately $850 million per last available longer-dated record but inferred net debt is around $766 million considering cash balances providing manageable leverage ahead of further disclosures [F1][S2].
Capital spending remains concentrated on facility improvements including new dealership construction supporting organic growth alongside acquisitions adding scale.[S1] Repurchases under Rule 10b5-1 trading plans were not adopted or terminated during this quarter indicating stable insider trading behavior.[S2]
Net income generation sustained above prior quarters despite elevated compliance investment needs demonstrating earnings resiliency reflective of mixed product mix favoring higher-margin services complementing cyclical auto sales environment.[N2][N3]
This analysis synthesizes publicly filed SEC disclosures alongside recent earnings commentary to present a fact-based internal evaluation without investment recommendations or speculation beyond documented evidence.
Disclaimer: This is research-only, informational analysis and not investment advice. It may include AI-generated interpretation and general industry context. Always verify important details using primary sources.
Comments