
PAR Technology Reinforces Omnichannel Strengths Amid Profitability Challenges
PAR Technology's integrated software-hardware platform drives revenue growth but persistent losses and customer concentration pose risks.
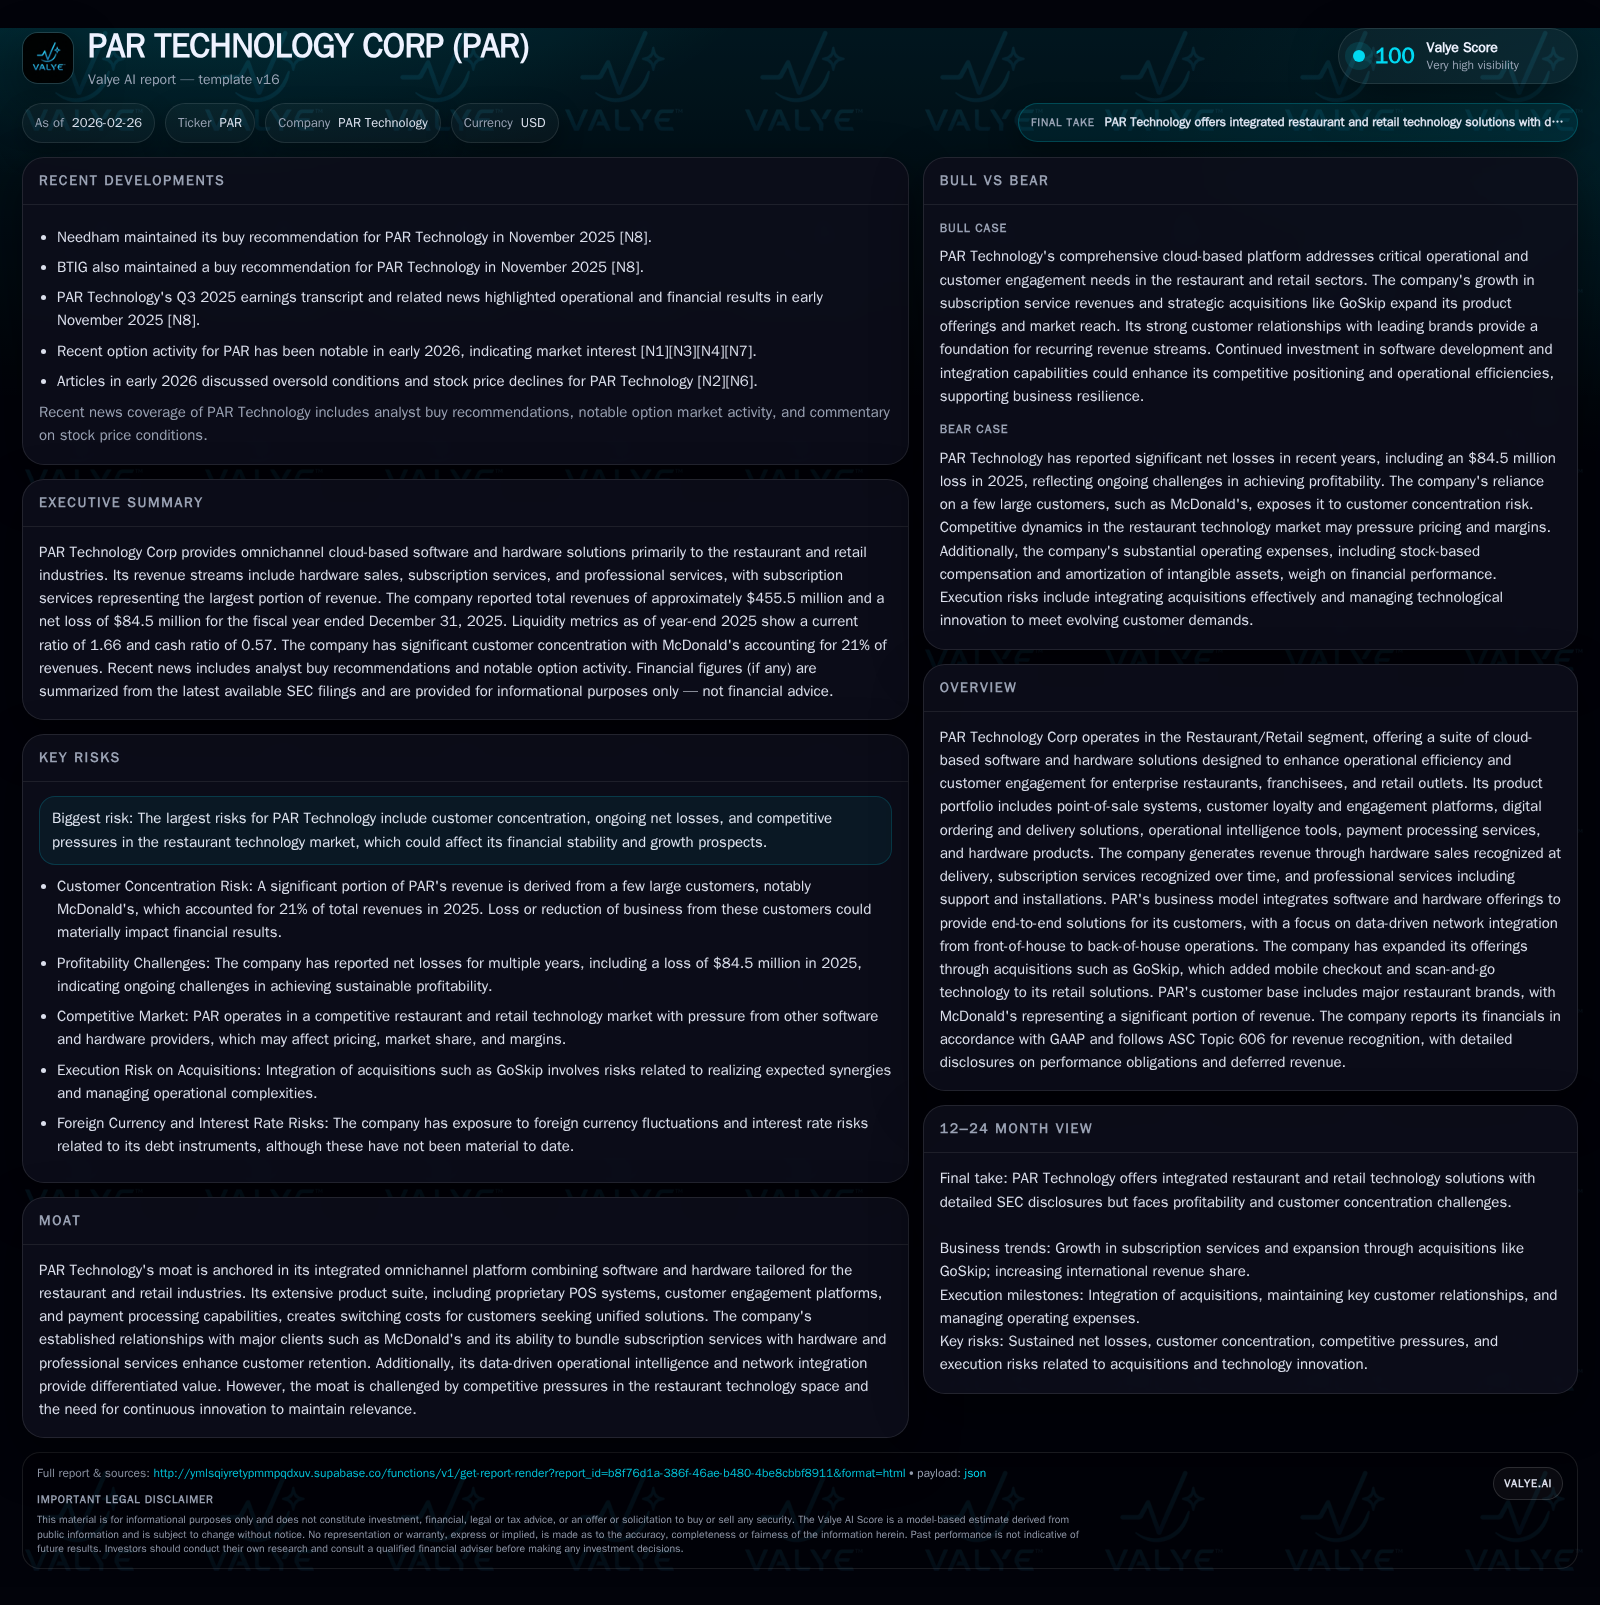
PAR Technology Corp delivered significant revenue growth from $276.7 million in 2023 to $455.5 million in 2025, fueled by expansion in both U.S. and international markets and broad product adoption. The company's omnichannel platform, combining hardware sales with subscription and professional services, solidifies its market position particularly among large clients like McDonald’s, which accounted for over 20% of revenues by 2025. Despite top-line momentum, PAR continues to face steep profitability headwinds, recording a net loss exceeding $84 million in 2025 and generating negative operating cash flows. Elevated capital expenditures and modest share repurchases define its current capital allocation amid ongoing competitive pressures.
Growth Trajectory and Revenue Drivers through 2025
PAR Technology has exhibited robust revenue growth over the three-year span from 2023 through 2025, with total revenues rising from approximately $276.7 million in 2023 to $455.5 million in 2025 as reported [F1]. This represents a compound annual growth rate around 31.4%, with a pronounced acceleration in the last year: revenue jumped nearly 30% from $350.0 million in 2024 to $455.5 million in 2025 [F1]. Geographic expansion played a critical role; U.S.-based revenues expanded from roughly $253.1 million in 2023 to $378.8 million in 2025, while international sales more than tripled from $23.6 million to $76.8 million over the same period according to segment disclosures [S4]. This mix shift evidences PAR's strategic push into global markets beyond its core domestic base.
Product diversification also supported this top-line performance. Hardware sales held steady yet represented a smaller portion of total revenues over time as subscription services—capturing SaaS offerings like Engagement Cloud and Operator Cloud—increased significantly [S5][S6]. Additionally, strategic acquisitions such as the GoSkip asset purchase expanded product breadth into cloud-POS solutions with mobile self-checkout offerings targeting retail verticals [S17]. Major clients including McDonald's accounted for increasingly larger shares of revenue (21% in 2025 up from 12% in 2023) underpinning volume scale but highlighting concentration [S7].
Historical performance (annual)
| FY | Net ($mm) | CFO ($mm) | OpInc ($mm) | Capex ($mm) | Net YoY |
|---|---|---|---|---|---|
| 2025 | -84 | -27 | -69 | 3 | -1593.6% |
| 2024 | -5 | -25 | -79 | 1 | +92.9% |
| 2023 | -70 | -17 | -60 | 6 | -0.6% |
| 2022 | -69 | -43 | -58 | 1 |
Source: SEC companyfacts cache [F1].
Capital returns and efficiency (annual)
| FY | FCF ($mm) | ROE% |
|---|---|---|
| 2025 | -30 | -10.2 |
| 2024 | -26 | -0.6 |
| 2023 | -23 | -20.9 |
| 2022 | -44 | -18.5 |
Source: SEC companyfacts cache [F1].
Table: PAR Technology Historical Performance (USD millions) based on SEC filings [F1]
Platform Innovation and Market Positioning in Restaurant Technology
PAR Technology's competitive advantage lies prominently in its fully integrated omnichannel platform that merges hardware and software seamlessly across the restaurant and retail landscapes . The company groups subscription services under two primary lines: Engagement Cloud—combining loyalty programs such as Punchh with ordering infrastructure—and Operator Cloud—which powers front-of-house POS systems like PAR POS alongside back-of-house operational suites including Delaget and Data Central [S5][S24].
This duality facilitates an end-to-end network—from customer engagement through operational management—enabling enterprise-level clients to harness insights through data-driven intelligence tools embedded within the platform . Moreover, PAR bundles these SaaS solutions with hardware deployments (point-of-sale terminals, mobile kiosks), payment processing capability via PAR Pay, and professional support services to lock-in clients via switching costs inherent to tightly coupled service systems [S24].
The company's deployment of subscription bundling influences recurring revenue predictability but requires ongoing innovation cycles given the intensely competitive restaurant technology sector marked by emergent disruptors offering modular or cloud-native alternatives .
Revenue Breakdown: Hardware, Subscriptions, and Services Dynamics
PAR recognizes hardware sales as point-in-time revenue upon product delivery or installation completion when control transfers to customers [S1][S23]. As a result, hardware revenues totaled roughly $106 million in fiscal year ending December 31, 2025 [S17], largely reflecting POS terminals and self-checkout kiosks acquired in recent transactions such as GoSkip [S17][S3].
Subscription services meanwhile represent the majority of recognized revenues (about $291 million for FY2025) accrued ratably over contract terms typically spanning one to three years consistent with SaaS best practices under ASC Topic 606 rules governing performance obligations [S24][S26][S27]. Contracts often encompass managed platform development support alongside transaction-based payment processing where PAR acts predominantly as principal accounting for gross revenue recognition after principal-agent evaluations [S1][S18][S21].
Professional services—including installation fees billed upon completion—contribute supplementary revenues recognized at a point-in-time but amortized if bundled closely with subscription contracts per contract accounting analysis [S24][S26]. This granularity underscores PAR’s multifaceted monetization model combining upfront product sales with long-term service subscriptions designed for scalability.
Customer Concentration Impact with Key Account Analysis
PAR's client portfolio features prominent restaurant chains exerting outsized influence on revenue composition; notably, McDonald’s accounted for approximately 21% of total revenues in FY2025 versus only about 12% three years prior, marking intensifying concentration risk [S7]. Yum! Brands and Dairy Queen similarly contributed meaningful percentages though declined slightly over time.
While these marquee relationships validate PAR's market penetration among leading foodservice operators, they also amplify financial exposure should contract dynamics shift unfavorably or competitive offerings gain traction within these large accounts [S9]. However, PAR’s integration of software-hardware bundles with specialized operational intelligence cultivates switching costs that may mitigate churn risk by increasing complexity for clients seeking alternative vendors once entrenched across multiple systems .
Nonetheless, dependency on a limited number of customers remains a vulnerability to monitor particularly given industry cyclicality affecting hospitality sectors.
Profitability Headwinds: Operating Losses and Cash Flow Overview
Despite sustained revenue gains nearing a doubling since FY2017 ($232M to $455M), PAR continues to struggle with profitability constraints reflecting cost structure pressures likely emanating from R&D investments, acquisition-related expenses, sales/marketing scale-up costs, amortization of intangible assets tied to acquisitions, and elevated operating leverage effects [F1][S14][S19]. The operating loss moderated somewhat from nearly $79 million in FY2024 to about $69 million in FY2025 yet remains at substantial magnitude relative to the business scale [F1]. Net losses ballooned to over $84 million due primarily to interest expense increases and valuation allowances despite non-operating gains partially offsetting expenses [F1][S4].
Cash flow profiles mirror these challenges; operating cash flow was negative approximately $27 million for FY2025 worsened relative to prior years' already negative figures while capital expenditures spiked sharply from below $1 million in FY2024 to over $3 million in FY2025 driven by technology platform expense capitalization as well as inorganic growth activities confirming intensified reinvestment into infrastructure [F1][S14][S19]. Collectively these trends indicate ongoing cash burn requiring prudent liquidity management.
Capital Allocation Decisions: Investments, Buybacks, and Returns
PAR’s capital allocation reflects prioritization of product development investment amid constrained profitability metrics with capex outlays more than tripling year-over-year ($970K in FY24 vs $3.32M in FY25) predominantly aligned toward enhancing software platforms and hardware capabilities as revealed through elongated software capitalization schedules under ASC guidance along with acquisition integrations [F1][S14][S19].
Dividend distributions remain nonexistent consistent with negative earnings pressure while share repurchases have historically been modest — latest available reports show buybacks only occurring pre-2023 at low single-digit millions levels emphasizing conservatism on capital returns amid performance headwinds [F1][S20]. Equity grew due mostly to stock issuance rather than retained earnings given steady accumulated deficits.
An approximate return on equity calculation based on net losses relative to shareholders’ equity yields about negative -10%, signifying ongoing value destruction for now though investments aim at longer-term value creation potential if new platforms achieve sufficient scale and margin improvements eventually realize operating leverage benefits [F1].
Future Outlook: Strategic Initiatives and Potential Constraints
Looking ahead, PAR has indicated consideration of strategic alternatives including potential acquisitions or divestitures to optimize portfolio fit alongside an emphasis on continued organic innovation within its omnichannel architecture focusing on expanding Engagement Cloud features internationally plus reinforcing Operator Cloud back-end analytics capabilities [N5][S2]. Recent asset acquisitions such as GoSkip underscore active expansion into adjacent retail technology segments intended to broaden recurring revenue sources beyond traditional restaurant workflows [N5][S17].
However, key constraints remain centered around intense competition requiring ongoing innovation investments plus managing concentrated client exposures amidst evolving restaurant industry dynamics influenced by labor cost inflation, changing consumer behavior post-pandemic recovery phases, and technology disruption waves forcing agility.
What to Watch: Earnings Milestones and Strategic Developments
Investors should monitor upcoming quarterly earnings releases where management is poised to update on customer contract renewals especially with marquee clients like McDonald's alongside topline acceleration sustainability amid macroeconomic uncertainties given recent notable options market activity signaling speculative positioning ahead of earnings calls documented for late February 2026 [N1][N3][N4][S3].
Additional focus should be placed on announcements regarding new partnership expansions or technology enhancements clarifying progress against stated strategic objectives along with any shifts toward non-core asset divestitures or financing activities that might impact liquidity or capital structure flexibility per latest SEC disclosures indicating active board-level review processes surrounding corporate strategy execution plans [N5][S2].
This report synthesizes detailed financial disclosures alongside business narratives without projecting investment outcomes or advising positions.
Disclaimer: This is research-only, informational analysis and not investment advice. It may include AI-generated interpretation and general industry context. Always verify important details using primary sources.
Comments