
Paycom Software’s Revenue Jump and Strategic Investment Patterns in 2025
Strong top-line growth in 2025 contrasts with compressed profits as Paycom increases investments in platform and sales capabilities.
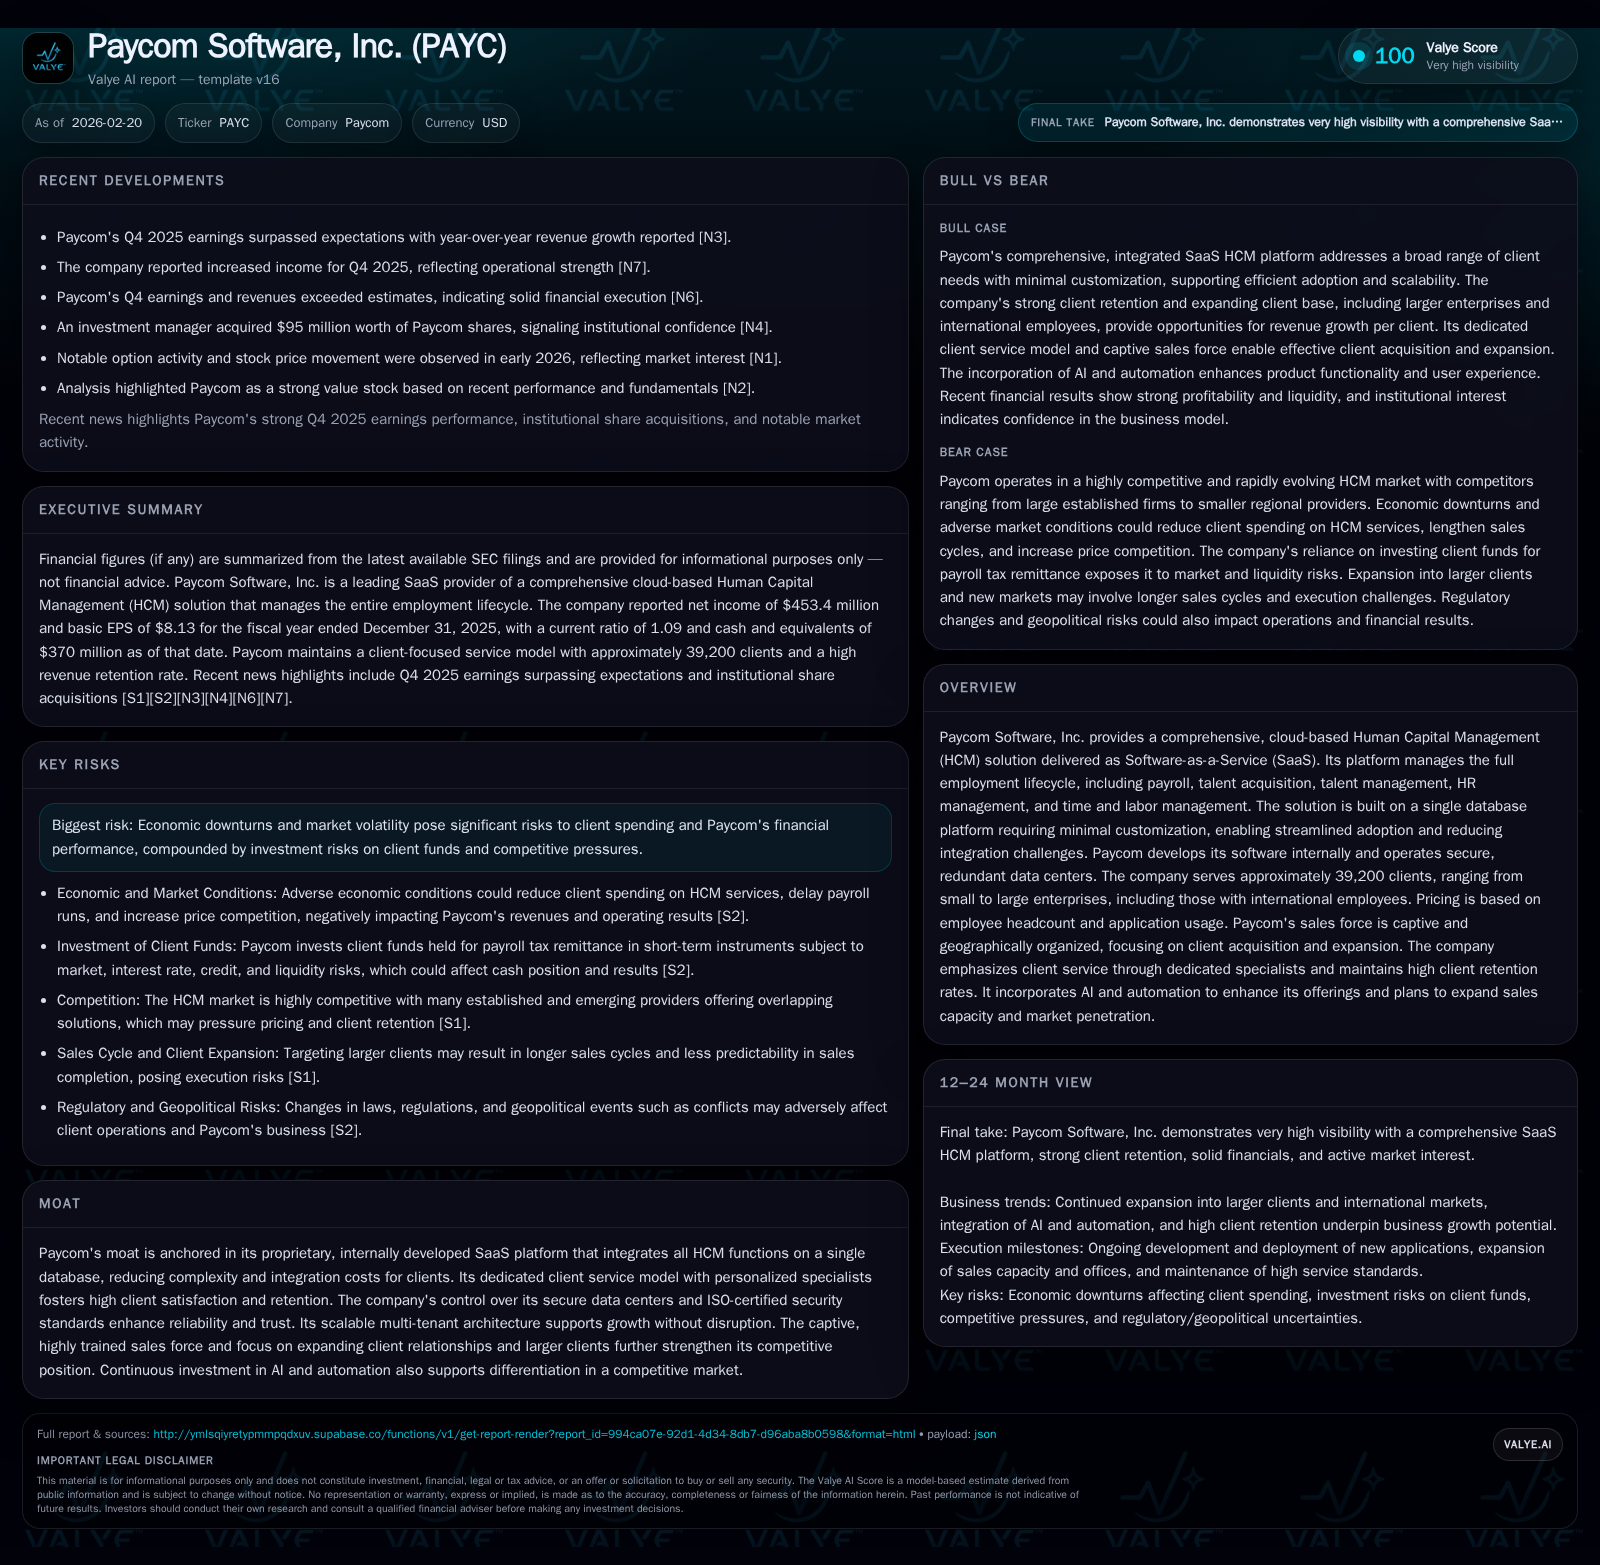
In 2025, Paycom Software posted a robust 31.8% revenue increase driven by both client base expansion and deeper penetration among larger enterprises. However, operating income declined by 10.6%, reflecting elevated sales and marketing expenses alongside rising capital investments in infrastructure. Operating cash flow grew 27.2%, supporting substantial capex spending that surged by over 40%, aimed at scaling the proprietary SaaS platform and data centers. The company continued to deploy capital aggressively into share repurchases while maintaining steady dividends, delivering an estimated 26.2% return on equity. Future growth hinges on longer sales cycles targeting larger clients and ongoing AI-driven product innovation, amid competitive and macroeconomic risks.
Historic Revenue Growth and Its Catalysts Through 2025
Paycom’s fiscal year 2025 results demonstrate an impressive acceleration in top-line performance, with revenues growing by a notable 31.8% year over year to approximately $1.88 billion [F1]. This surge is attributable to a combination of factors: an expanding client roster climbing beyond ~39,200 organizations [S17], deeper adoption of multiple HCM applications within existing clients, and increasing traction among larger enterprises with complex HR needs [S4],[N1].
The company's proprietary SaaS platform—built on a single database architecture—continues to streamline client onboarding and reduce integration costs, enabling quicker deployment especially among small-to-medium businesses who experience faster sales cycles (30–90 days) [S4]. At the same time, Paycom’s focus on capturing larger clients (>1,000 employees) offers a material opportunity to increase revenue per client without commensurate incremental cost, although it introduces longer sales cycle durations and some unpredictability in closing deals [S13].
This diversified approach—a mix of faster-closing SMBs bolstered by strategic pursuit of larger enterprises—underpins Paycom’s strong organic growth engine.
Shift in Profitability Dynamics: Operating Income and Net Income Trends
Despite robust revenue gains, operating income contracted by roughly 10.6% year over year in 2025 to $567 million [F1]. Net income followed suit with a near 9.7% decline to $453 million [F1]. This profit compression primarily reflects elevated operating expenses tied to aggressive client acquisition strategies, including higher sales commissions linked to increasing average contract values from upselling multiple SaaS modules [N2],[S15].
Additionally, Paycom has ramped R&D investment aimed at broadening its solution capabilities and embedding advanced automation/AI features such as the IWant voice-command AI engine that enhances user interactivity within the unified database [S17],[N8]. The capitalization and amortization effects of these investments further weigh on margins in the near term [S15].
The overall pattern underscores a classic SaaS tradeoff: sacrificing short-term operating leverage for long-term platform enhancements and expanding market presence.
Operational Cash Flow Resilience Amidst Increased Capital Expenditure
On the cash flow front, Paycom posted a resilient increase of approximately 27.2% in operating cash flow to $679 million during FY2025 [F1]. This robust cash generation underpins significant capital expenditure outlays that jumped by over 40% to nearly $271 million [F1],[S20].
The bulk of this capex has been directed toward expanding and upgrading secure multi-tenant data centers located primarily in Oklahoma, Texas, and Arizona that are wholly owned by Paycom [S21],[S24]. These facilities feature state-of-the-art biometric security systems, redundant power supplies, environmental controls such as heat/fire/moisture sensors, plus load-balanced network architectures designed for high availability.
This physical infrastructure investment is fundamental for sustaining the scalable delivery model supporting tens of thousands of clients simultaneously accessing real-time HR data without disruption—an increasingly important competitive advantage given rising security and uptime expectations.
Examining Capital Allocation: Dividends, Buybacks, and Investment in Infrastructure
Capital allocation policies illustrate a balance between returning capital to shareholders while funding growth initiatives. In FY2025, dividends remained flat at $84.8 million compared with the prior year [F1],[S14]. However, share repurchases accelerated dramatically from $122.8 million in FY2024 to $325.5 million in FY2025 signaling strong confidence from management about internal cash generation capacity despite margin pressures.
With stockholders’ equity rising to about $1.73 billion by year-end FY2025 [F1], Paycom generated an estimated return on equity near 26.2%, reflecting efficient use of equity capital backed by high cash conversion ratios [F1]. The combination of steady dividends plus elevated buyback activity suggests a disciplined approach aiming both at shareholder value enhancement and flexibility to support future operational scaling.
Future Growth Outlook Driven by Client Expansion and Platform Innovation
Looking ahead, Paycom highlights opportunities tied closely to penetrating existing markets more deeply while expanding its footprint among large enterprise customers domestically and globally—with increasing native payroll support soon planned in Canada, Mexico, UK/Ireland—and an emphasis on international employees within multinational clients [N1],[S13],[N8].
The potential multiple-application adoption within clients bolstered by AI-driven automation features such as IWant positions Paycom favorably amidst growing demand for seamless employee self-service options that reduce administrative workloads [S17],[N7]. The lengthened sales cycles inherent when pursuing large accounts presents near-term timing risk but arguably increases lifetime client value.
Risks from Macroeconomic Volatility and Competitive Pressures
Paycom remains exposed to macroeconomic headwinds including economic downturns which could induce clients to cut back or delay discretionary HCM expenditures along with unscheduled payroll runs (bonuses), lengthen sales cycles or prompt pricing pressure—especially acute for smaller business segments sensitive to cost increases [S2],[S26].
Market volatility also impacts returns on funds temporarily held for clients between payroll receipt and taxation payments—a unique operational risk increasing amidst financial market uncertainty [S2]. Competition is intense from legacy players transitioning fully or partially to cloud-based SaaS HCM platforms (e.g., ADP, Workday), as well as newer entrants offering modular HR solutions or embedded payroll functionalities [S4]. Distinguishing factors include scope of features needed by large businesses versus price sensitivity among smaller ones—demanding a flexible go-to-market strategy.
What To Watch Next: Sales Leadership Changes and AI Investments
A noteworthy development is the appointment of Shane Hadlock as President and Chief Client Officer early in 2026 — placing him as principal operating officer responsible for day-to-day operations including oversight of COO Randy Peck’s functions [N3],[S3]. This leadership shift signals intensified focus on client-centric execution amidst evolving market dynamics.
Concurrently, sustained focus on integrating AI across workflow functions (beyond voice-driven interfaces) represents a strategic lever for differentiation that may impact client acquisition costs positively while improving retention through smarter automation tools [N7],[N8]. Observers should monitor quarterly updates for commentary regarding sales productivity metrics amid longer sales cycles targeting larger clients.
Historical performance (annual)
| FY | Net ($mm) | CFO ($mm) | OpInc ($mm) | Capex ($mm) | Net YoY |
|---|---|---|---|---|---|
| 2025 | 453 | 679 | 567 | 271 | -9.7% |
| 2024 | 502 | 534 | 634 | 193 | +47.3% |
| 2023 | 341 | 485 | 451 | 193 | +21.1% |
| 2022 | 281 | 365 | 379 | 133 |
Note: Omitted columns lack sufficient annual XBRL coverage in the provided tags (need ≥2 annual points): Rev. Source: SEC companyfacts cache [F1].
Capital returns and efficiency (annual)
| FY | Div ($mm) | Buybacks ($mm) | FCF ($mm) |
|---|---|---|---|
| 2025 | 85 | 326 | 408 |
| 2024 | 85 | 123 | 341 |
| 2023 | 65 | 287 | 292 |
| 2022 | 95 | 232 |
Source: SEC companyfacts cache [F1].
Note: Revenue figures for years prior to recent filings are incomplete; YoY growth percentages calculated where available.
Disclaimer: This analysis is based solely on publicly available documents including SEC filings ([S#]) and news articles ([N#]) as well as structured financial data ([F1]). It does not constitute investment advice or recommendations but aims to provide an informed perspective on Paycom Software’s historical performance and strategic positioning within the evolving Human Capital Management industry landscape.
Disclaimer: This is research-only, informational analysis and not investment advice. It may include AI-generated interpretation and general industry context. Always verify important details using primary sources.
Comments