
Principal Financial Group’s Q1 Earnings Beat with Margin Resilience Amid Revenue Pressure
Despite a year-over-year revenue decline, Principal Financial Group posted a robust Q1 2026 net income, reflecting operational resilience across its diversified financial services segments.
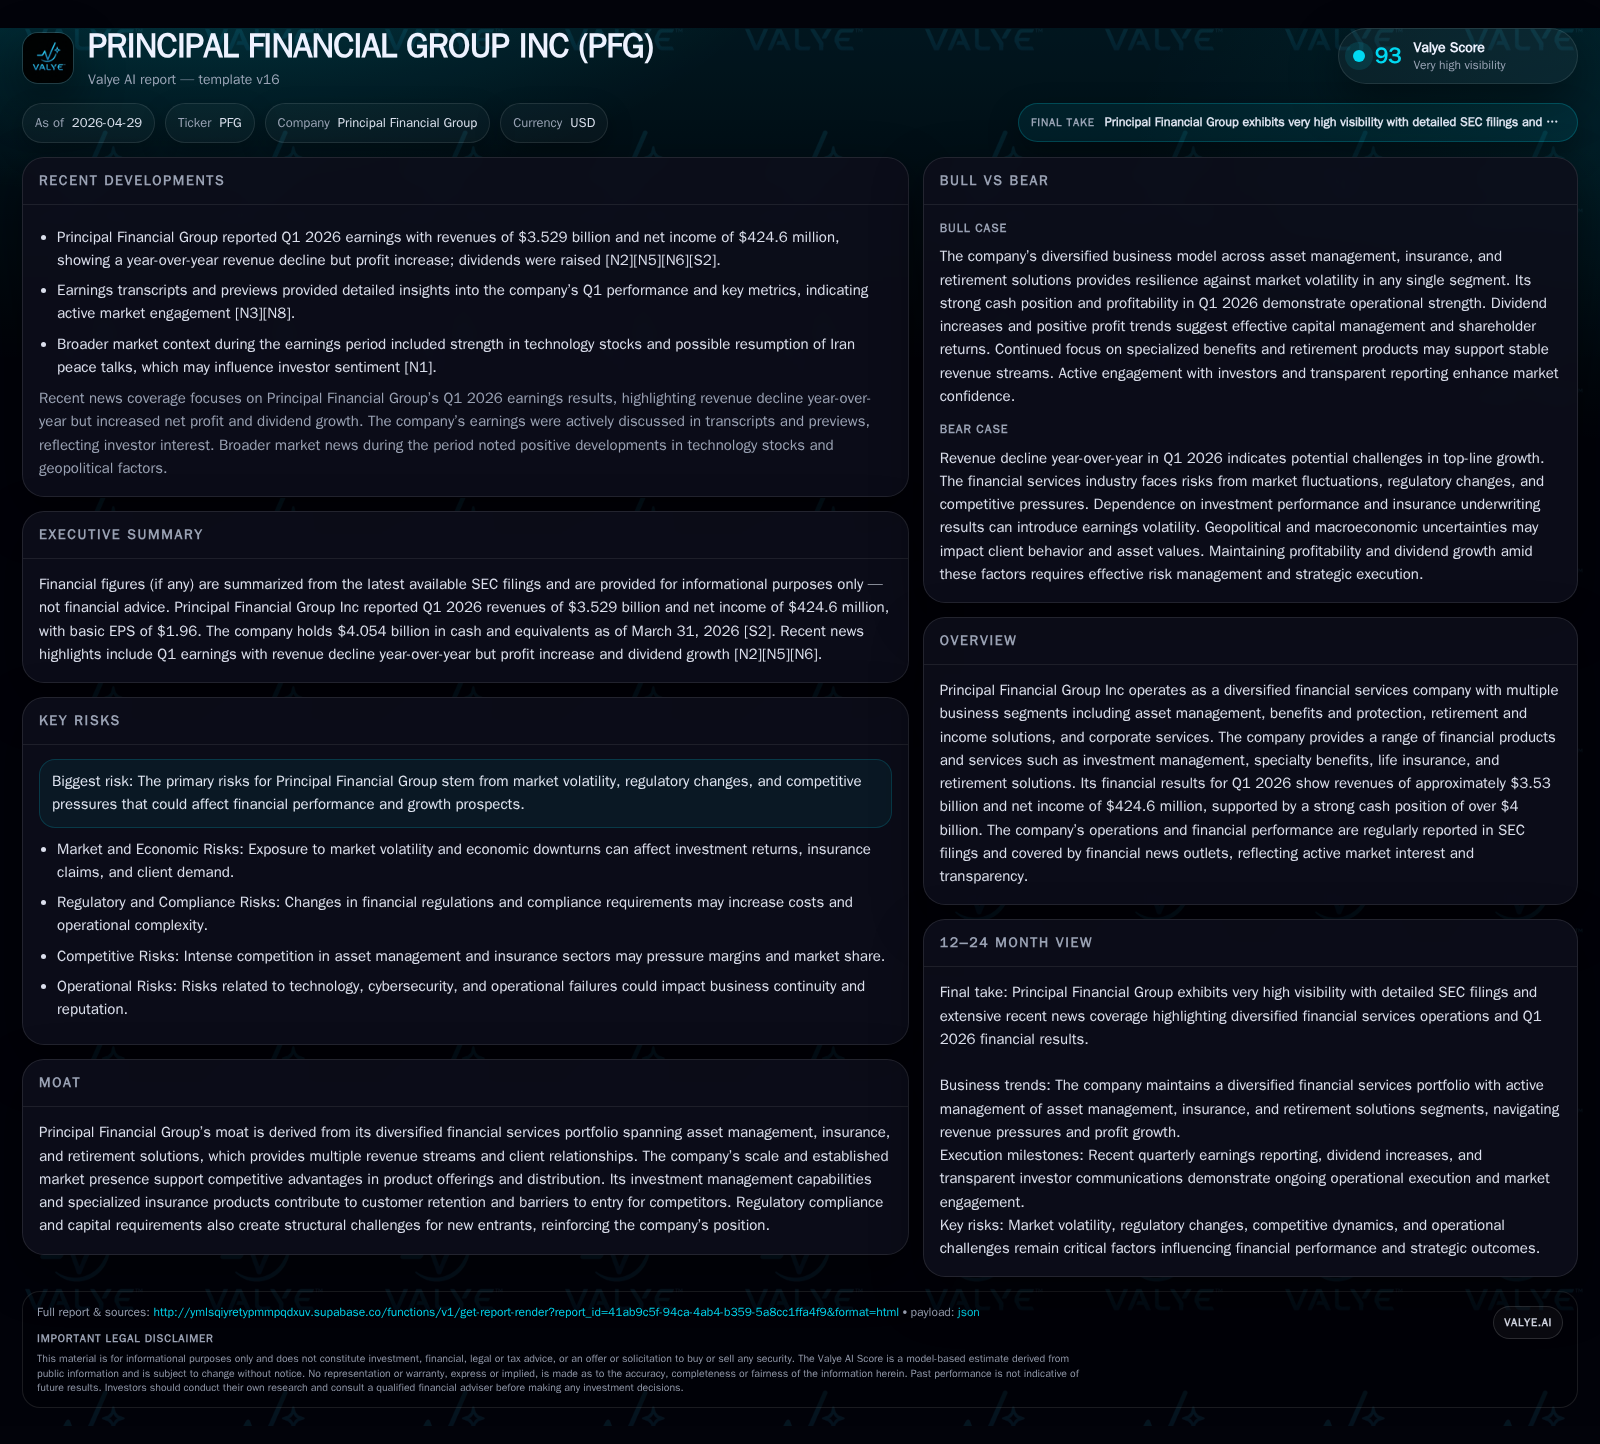
Principal Financial Group reported Q1 2026 revenues of $3.53 billion and net income of $424.6 million, exceeding expectations amid a challenging market environment. Revenue pressures were partly offset by effective expense management and margin gains. The company’s business model leverages diversification across asset management, insurance, and retirement solutions, providing multiple stable revenue streams. Key growth drivers include demographic trends supporting retirement demand and ongoing product innovation, while risks center on market volatility and regulatory shifts.
Latest Quarterly Operating Update: Earnings Beat and Revenue Challenges
Principal Financial Group’s first-quarter 2026 results highlight operational fortitude during revenue headwinds. The company earned a net income of $424.6 million on revenues of approximately $3.53 billion for the quarter ended March 31, 2026, surpassing consensus earnings expectations despite a year-over-year top-line contraction [S2][N2]. This discrepancy reflects improved margin resilience driven by effective expense discipline and favorable operating leverage within its diversified platform.
Alongside earnings data, Principal announced an increased quarterly dividend, reinforcing management's confidence in sustained cash flow generation amidst continuing market uncertainties [S3][N5]. The dividend decision also suggests a strategic balance between shareholder returns and capital preservation to navigate evolving regulatory landscapes.
Business Model and Service Portfolio: Diversification Across Asset Management, Insurance, and Retirement Solutions
Principal Financial Group operates as a diversified financial services conglomerate, generating revenues through several synergistic segments: Principal Asset Management; Benefits & Protection comprising specialty benefits and life insurance; Retirement & Income Solutions; and Corporate Services including administrative functions [S1][S2].
Principal Asset Management contributes primarily through fees from managing assets across investment management products and international pension solutions—a critical locus during rising global pension demands. Benefits & Protection delivers specialty benefit products alongside traditional life insurance offerings catering to both individual and group clients. The Retirement & Income Solutions segment addresses the growing need for retirement planning vehicles such as annuities and defined contribution products. Corporate Services underpin these fronts by offering complementary administrative support.
This multi-segment structure underpins steady fee income streams even during episodic market swings—asset management fees tied to assets under management (AUM) provide recurring revenues while insurance premiums add product diversity. Specialty benefits products exhibit higher retention rates due to customization aligned with client workforce needs, aiding in customer stickiness.
Competitive Positioning in Financial Services: Scale, Moat, and Regulatory Barriers
Principal’s competitive advantage emerges from scale economies inherent to its substantial AUM base alongside integrated financial offerings that enable cross-selling across client relationships. The firm's established brand trust within the U.S., coupled with disciplined risk management frameworks ensuring regulatory compliance in both insurance underwriting and asset management activities, restricts new entrants who face substantial capital hurdles and compliance complexities [S1][F1].
Competition spans global asset managers that contest fee margins but may lack breadth in specialty benefit products; traditional insurers face challenges from niche providers but often lack integrated retirement product suites balancing risk exposure effectively.
Notably, stringent regulatory capital requirements imposed on insurers raise barriers against smaller or less capitalized competitors which sustains principal’s incumbency advantage especially in the Benefits & Protection segment.
Drivers Sustaining Growth: Client Relationships, Product Innovation, and Market Expansion
Key growth engines underpinning Principal’s future outlook include the expanding retirement market fueled by demographic trends such as aging populations requiring income solutions post-retirement [S1][S2]. This structural driver bodes well for annuities and defined contribution plan offerings whose demand correlates directly with longevity expectations.
Additionally, ongoing enhancement of investment management capabilities—through active strategies aligned with evolving ESG mandates—and innovative specialty benefit products designed for emerging workforce expectations contribute materially to client acquisition and retention. Cross-selling digital tools for seamless client engagement enhances stickiness.
International pensions represent an incremental avenue for growth leveraging Principal’s established expertise domestically abroad where pension systems evolve with regulatory encouragements for private savings plans.
KPIs supporting these drivers include net inflows into managed funds, increases in new policy issuance within specialty benefits segments, and improved retention rates across insurance products [S2].
Risks and Constraints: Market Volatility, Regulatory Environment, and Revenue Pressures
Principal faces risks chiefly from macroeconomic uncertainties driving equity market volatility that directly impacts asset values underpinning AUM-based fee revenues [S1][N3]. Such volatility can compress fees if outflows materialize or benchmark indices falter.
The regulatory landscape continues evolving with potential tightening of reserving requirements or capital adequacy norms affecting insurance product profitability. Legislative adjustments governing retirement plans can alter product attractiveness or require costly process adaptions.
Competitive pricing pressures may challenge margins particularly if inflows slow given rising alternative financial service providers emphasizing fee compression.
These factors collectively temper the pace of topline growth even as cost controls support bottom-line resilience.
Key Upcoming Catalysts: Guidance, New Product Launches, and Demand Indicators
Investors should monitor forthcoming fiscal year 2026 guidance updates expected in subsequent quarterly disclosures for clearer directional cues on revenue trajectory and margin outlooks [N3][S3].
Principal has flagged development pipelines focused on expanded specialty benefits offerings—including tailored disability coverages—and further international pension solutions rollout aimed at leveraging global demographic tailwinds.
Early indicators such as quarterly policy sales volume expansions within protection lines or sustained net fund inflows will serve as barometers of execution success.
Margin trend analysis alongside operating expense ratios will remain key metrics signaling whether cost discipline offsets top-line pressures effectively.
Financial Snapshot: Cash Position, Debt Structure, and Profitability Metrics
Latest financial snapshot
| Metric | Value | Period |
|---|---|---|
| Cash & equivalents | $4.1bn | |
| 2026-03-31 | ||
| Total debt | $4.0bn | |
| 2025-12-31 | ||
| Net debt | $-95mm | |
| 2025-12-31 |
Source: SEC companyfacts cache [F1].
At quarter-end March 31, 2026, Principal reported cash and cash equivalents totaling $4.05 billion against total debt approximating $3.96 billion as of December 31, 2025 implying a modest net debt position roughly negative $95 million [F1]. This liquidity buffer provides operational flexibility to absorb market shocks or invest opportunistically.
The profitability profile manifested through Q1 net income of $424.6 million signals strong earnings quality amid revenue declines measured at $3.53 billion for the period [S2][F1]. Expense controls likely contributed positively to margin expansion although explicit segment margin disclosures would further clarify dynamics.
Overall financial solidity supports the company's ability to fund dividends sustainably while backing strategic investments requiring capital allocation.
| Metric | Value | Period End |
|---|---|---|
| Cash & Equivalents | $4.05 billion | March 31, 2026 |
| Total Debt | $3.96 billion | December 31, 2025 |
| Net Debt | -$95.5 million | December 31, 2025 |
| Quarterly Revenue | $3.53 billion | March 31, 2026 |
| Quarterly Net Income | $424.6 million | March 31, 2026 |
This analysis synthesizes validated SEC filings alongside reputable news sources without conjecture beyond cited evidence. It offers a grounded perspective suitable for informed portfolio evaluation without prescribing investment action.
Disclaimer: This is research-only, informational analysis and not investment advice. It may include AI-generated interpretation and general industry context. Always verify important details using primary sources.
Comments