
Provident Financial Services Posts Robust Earnings Swing on Diversified Loan Portfolio
Provident Financial Services demonstrates strong net income rebound in 2025 driven by portfolio diversification and disciplined capital management.
Provident Financial Services Inc reported a significant net income increase of 152% in fiscal 2025, supported by its diversified loan portfolio and improved operational cash flows. The company showed a striking increase in investment activity alongside steady cash flow growth, underpinned by wealth management and insurance fee contributions. Capital allocation remained disciplined with a growing dividend payout and new share repurchase authorizations. Credit quality metrics remain stable despite economic uncertainties, while management navigates evolving regulatory pressures impacting loan pricing and credit risk. Future performance hinges on loan growth composition, margin stability, and efficient capital deployment.
Historical Earnings Momentum and Portfolio Dynamics Driving Growth
Provident Financial Services demonstrated a remarkable financial turnaround in fiscal year 2025, posting net income of approximately $291.2 million compared to $115.5 million in the prior year—an impressive 152% increase [F1]. This swing reflects the company's ability to leverage its diversified loan portfolio, which encompasses residential mortgages, commercial loans including multifamily properties, and consumer credit products as detailed in recent SEC disclosures [S1]. The variation in earnings aligns with shifts favoring higher-yielding commercial segments while maintaining underwriting discipline referenced in the risks section of their latest 10-K [S29]. Such diversification stabilizes interest income streams mitigating concentration risk inherent in any single loan category.
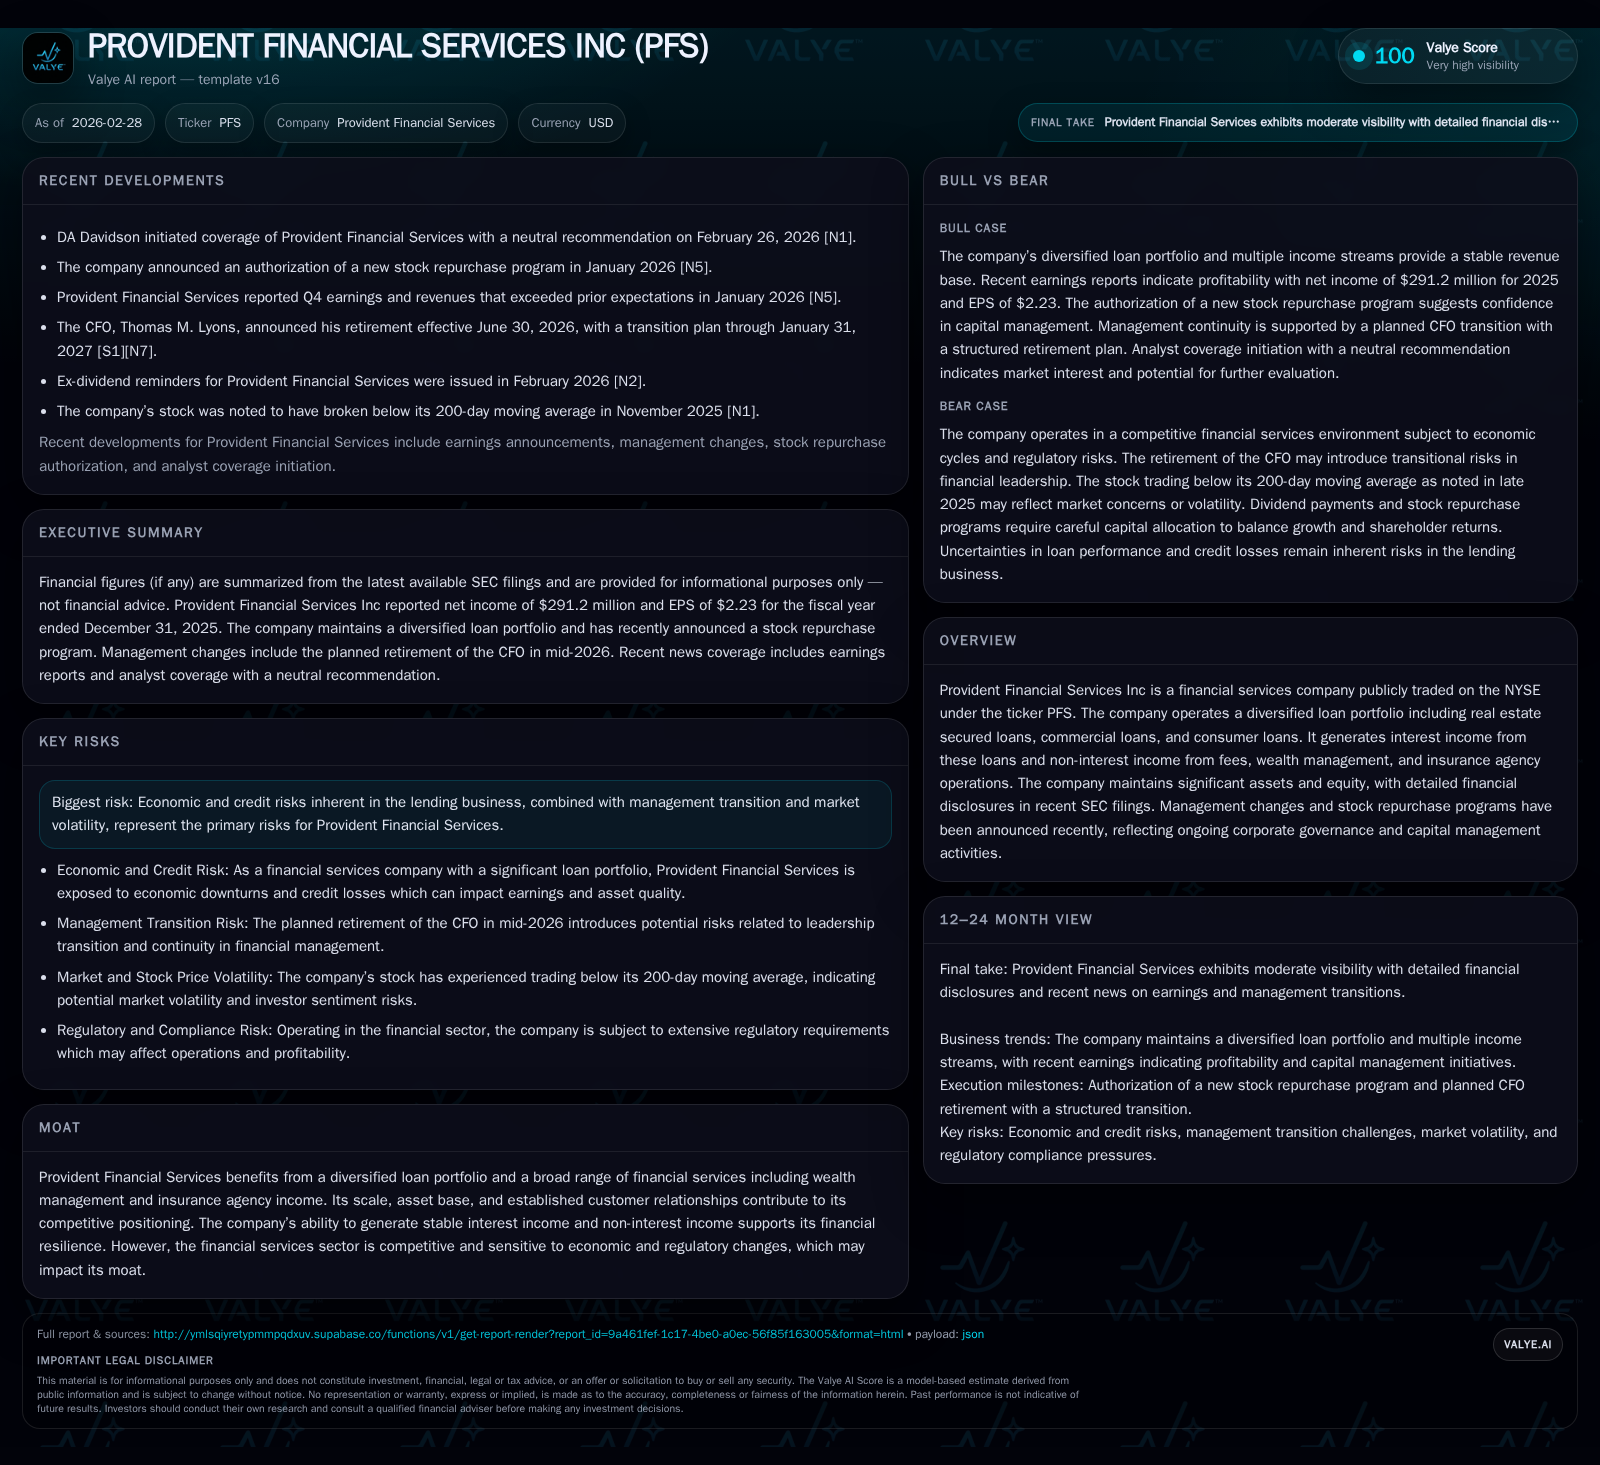
Historical performance (annual)
| FY | Net ($mm) | CFO ($mm) | Capex ($mm) | Net YoY |
|---|---|---|---|---|
| 2025 | 291 | 442 | 12 | +152.0% |
| 2024 | 116 | 426 | 1 | -10.0% |
| 2023 | 128 | 173 | 7 | -26.9% |
| 2022 | 176 | 200 | 9 |
Source: SEC companyfacts cache [F1].
Capital returns and efficiency (annual)
| FY | Div ($mm) | Buybacks ($mm) | FCF ($mm) |
|---|---|---|---|
| 2025 | 126 | 0 | 431 |
| 2024 | 101 | 0 | 425 |
| 2023 | 72 | 0 | 166 |
| 2022 | 72 | 47 | 191 |
Source: SEC companyfacts cache [F1].
Recent Operating Cash Flow Strength and Increased Investment Activity
The operational side reveals steady growth in operating cash flow for 2025 at $442.3 million, marking a moderate gain of 3.7% year-over-year from $426.4 million recorded in 2024 [F1]. This stability is notable given the broader macroeconomic fluctuations impacting credit markets. Capital expenditures expanded sharply from about $1.3 million in 2024 to $11.5 million in 2025 [F1], suggestive of heightened strategic investments possibly focused on expanding branch infrastructure or upgrading technology platforms to enhance customer service capabilities [S2]. The resulting free cash flow remained robust at roughly $430.7 million (operating cash flow minus capex), highlighting strong internal liquidity supporting ongoing operational needs and shareholder returns.
Latest Earnings Beat and Management Commentary Highlights
Q4 earnings announcements underscored Provident’s operational resilience with results topping consensus estimates on both earnings and revenue fronts [N1][N2]. Management commentary during the earnings call emphasized solid net interest margin retention despite rate environment pressures, alongside increased fee income contributions from wealth management services and insurance agency operations [N4][N5]. Credit costs appeared contained through proactive risk controls bolstered by vigilant underwriting and portfolio monitoring practices mentioned during these sessions.
Loan Portfolio Composition and Credit Risk Considerations
The company’s loan book remains well-balanced across key segments: residential mortgages comprise a substantial portion but are complemented by extensive commercial mortgage exposure—multifamily loans notably forming a meaningful subset—and consumer loans [S4][S8]. Importantly, nonperforming financing receivables remain within manageable bounds without significant deterioration quarter-over-quarter, signaling sound asset quality [S9]. Reserve levels are calibrated to anticipated losses reflecting prevailing economic uncertainties combined with regulatory expectations outlined in SEC risk filings [S29]. Prudential underwriting adjustments continue to align loan terms and pricing discipline with evolving market conditions.
Capital Allocation Approach: Dividends, Buybacks, and Equity Evolution
Provident Financial Services maintains consistent capital return policies evidenced by steady dividend increases—a payout sum of $125.9 million was distributed in 2025 compared to $100.9 million the year prior [F1]. The board authorized a new stock repurchase program shortly after year-end permitting up to approximately 2.15% of outstanding shares to be repurchased without strict temporal limits [N10][S21]. However, actual buybacks have been dormant for three consecutive years through fiscal 2025 reflecting either ongoing opportunistic considerations or prioritization of balance sheet strength [F1]. Equity capital expanded markedly over recent years reaching nearly $2.8 billion by end-2025 evidencing retained earnings build-up supporting growth funding needs [F1].
Navigating Regulatory and Market Risks Amid Sector Challenges
Management’s risk disclosures reveal heightened vigilance towards shifting regulatory landscapes that could impact lending standards and cost structures [S29]. Market volatility derived from uncertain economic cycles also informs credit loss projections shaping cautious loan pricing strategies thus preserving credit margins. Strategic responses include enhanced compliance frameworks coupled with scenario planning for adverse events—critical for sustaining long-term financial health.
Outlook and Catalysts for Future Performance Trajectory
While explicit forward guidance remains limited, investors should closely watch key metrics such as the trajectory of loan portfolio composition—particularly growth rates within commercial versus consumer lending—and net interest margin developments influenced by rate environment dynamics [N6]. Additionally, capital deployment efficiency following the ramp-up of investment spending alongside realized benefits from newly authorized stock repurchases provide signals of management’s prioritization between growth initiatives and shareholder returns. Upcoming earnings releases will likely shed light on how these factors coalesce amid broader economic trends.
This analysis strictly synthesizes available financial statements, SEC filings, and recent market communications as of February 28, 2026 without offering investment advice or price projections.
Disclaimer: This is research-only, informational analysis and not investment advice. It may include AI-generated interpretation and general industry context. Always verify important details using primary sources.
Comments