
Phunware’s AI-Driven Push Reshapes Mobile Guest Engagement Despite Profitability Challenges
Phunware leverages AI innovations in hospitality-focused mobile SaaS, though its financials reveal ongoing losses amid leadership shifts.
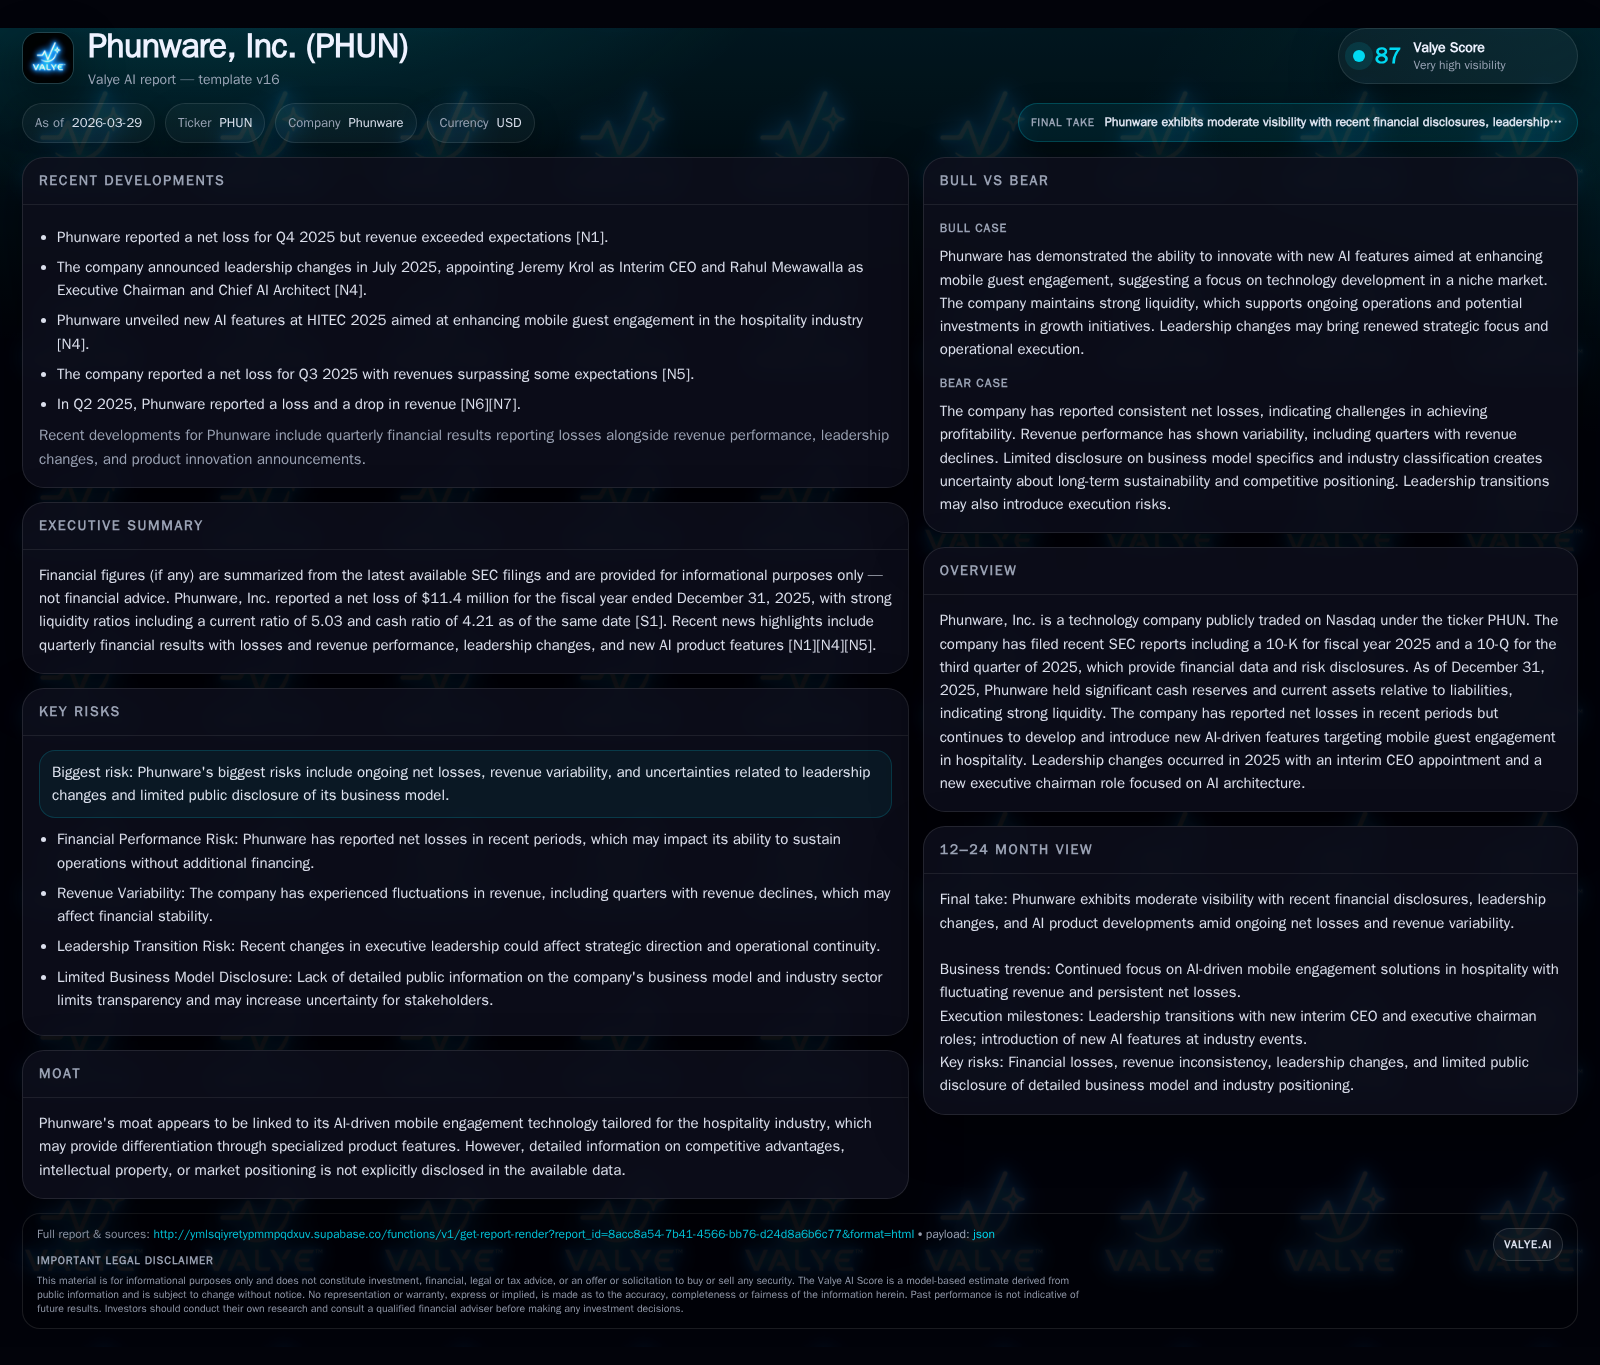
Phunware has strategically pivoted to an AI-powered mobile engagement platform tailored for the hospitality sector, differentiating itself with specialized capabilities. Despite limited disclosed revenue data, the company continues to grapple with persistent net losses and negative operating cash flow. Leadership changes in 2025, including a new interim CEO and roles emphasizing AI architecture, signal renewed focus on technology innovation but also add uncertainty. Strong liquidity supported by substantial cash reserves contrasts with operational cash burn, underscoring financial challenges as Phunware balances growth initiatives with profitability pressures.
Financial Overview: Persistent Losses Amid Growth Initiatives
Phunware Inc.’s financial results reveal continued challenges in translating growth into profitability. While specific annual revenue figures are limited—with the latest available revenue data at approximately $30.9 million reported for 2018 ([F1])—the company’s operating income and net income have remained negative through FY2025.
Operating income declined significantly by about 47.7% year-over-year from FY2024 to FY2025, reaching -$20.5 million in 2025 ([F1]). Net losses narrowed slightly but stayed substantial at -$11.4 million for FY2025 ([F1]). Operating cash flow improved modestly by 6.3% year-over-year but remained negative at approximately -$12.5 million ([F1]), indicating ongoing operational cash burn.
Historical performance (annual)
| FY | Net ($mm) | CFO ($mm) | OpInc ($mm) | Net YoY |
|---|---|---|---|---|
| 2025 | -11 | -12 | -21 | -10.5% |
| 2024 | -10 | -13 | -14 | +80.5% |
| 2023 | -53 | -18 | -46 | -3.7% |
| 2022 | -51 | -27 | -30 |
Source: SEC companyfacts cache [F1].
Capital returns and efficiency (annual)
| FY | ROE% |
|---|---|
| 2025 | -11.8 |
| 2024 | -9.6 |
| 2023 | 460.7 |
| 2022 | -204.5 |
Source: SEC companyfacts cache [F1].
Note: Revenue data is only available for FY2018; recent years’ revenue figures were not disclosed.
Core Differentiator: AI-Powered Hospitality Mobile SaaS
Phunware's platform centers on AI-driven mobile guest engagement specifically designed for the hospitality industry ([N1][S1]). This focus includes real-time location-based messaging and personalized guest journey orchestration integrated within hotel property management systems. This niche specialization offers a technological moat by addressing unique operational needs of hotels and resorts aiming to enhance guest experience and loyalty.
Leadership Changes Signal Strategic Emphasis on AI
Mid-2025 leadership changes saw Jeremy Krol appointed as interim CEO after serving as EVP and COO ([S24][N1]). The introduction of an executive chairman role focused on AI architecture underscores the company’s commitment to embedding artificial intelligence more deeply into its product development pipeline. These moves reflect a strategic pivot towards accelerating innovation but introduce execution risks associated with rapid management transitions.
Capital Allocation: Conservative Approach Amid Cash Burn
Phunware maintains robust liquidity with over $100 million in cash and equivalents against current liabilities of approximately $23.9 million as of December 31, 2025 ([F1][S14]). The resulting current ratio of about 5x provides a strong buffer to support ongoing investments.
The company has not declared or resumed any dividends according to filings ([S8][S10]), and share buybacks have been minimal recently—with a small repurchase recorded in FY2023 ([F1]). This suggests a prioritization of reinvestment into growth and R&D over shareholder returns during this transformation phase.
Risk Factors and Outlook
Risks include ongoing net losses driven by revenue variability linked to contract timing typical in SaaS models serving hospitality clients ([S4][S6]), competitive pressures within the hospitality technology sector impacting pricing and margins ([N1]), and uncertainties tied to leadership turnover.
Forward-looking statements remain limited publicly; investors should monitor sequential margin improvements and customer acquisition metrics as indicators of potential operational leverage gains.
Disclaimer: This analysis is based solely on publicly available information up to March 29, 2026. It does not constitute investment advice or recommendations.
Disclaimer: This is research-only, informational analysis and not investment advice. It may include AI-generated interpretation and general industry context. Always verify important details using primary sources.
Comments