
P3 Health Partners Faces Capital Constraints Amid Growing Medicare Advantage Footprint
The company’s physician-led value-based care model drives revenue growth but is challenged by ongoing operating losses and liquidity concerns.
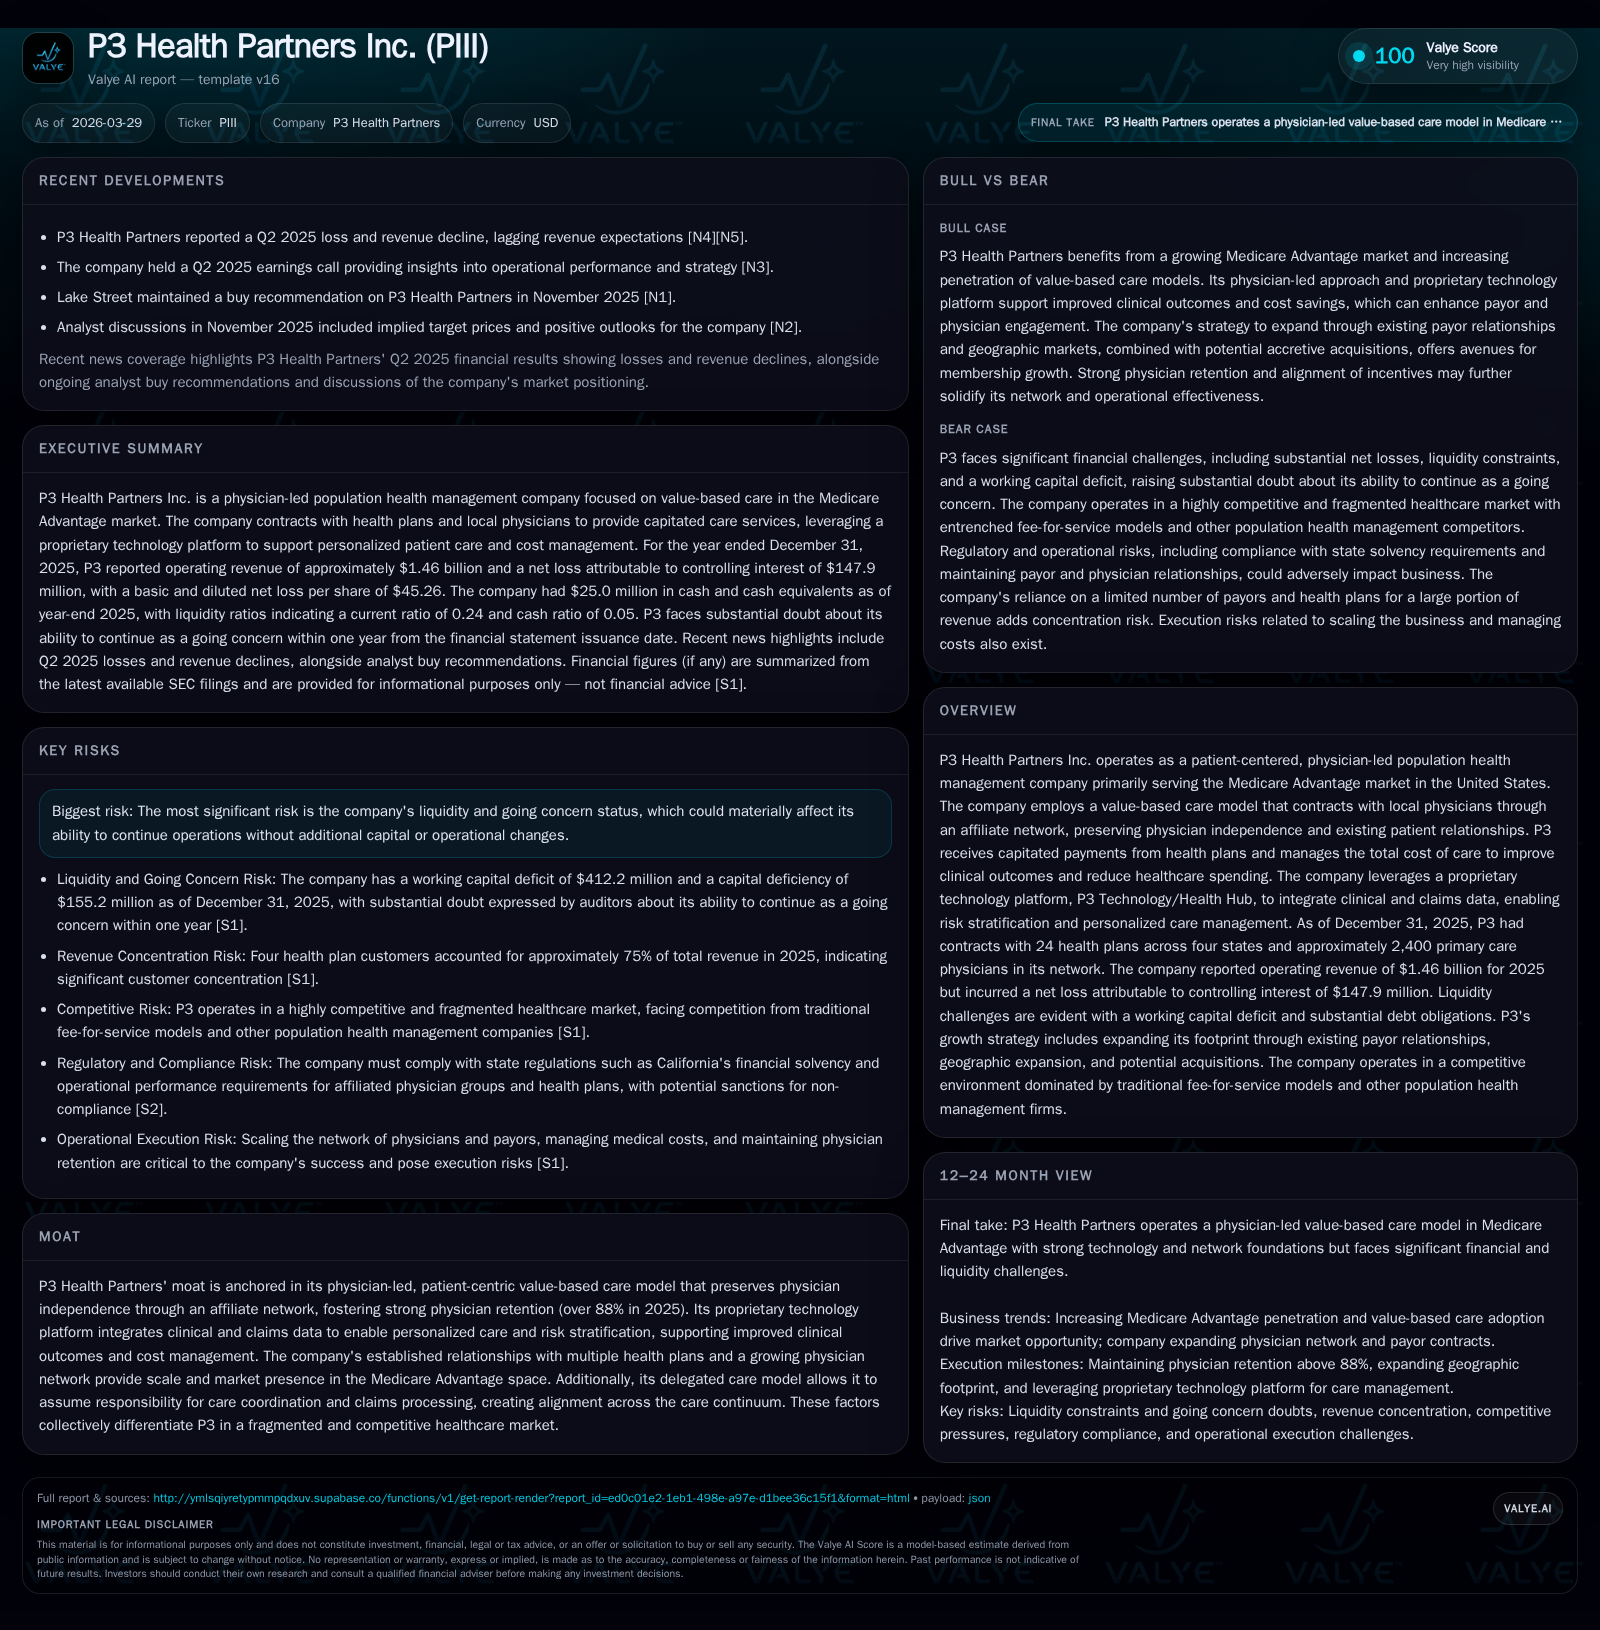
P3 Health Partners Inc. has expanded its presence in the Medicare Advantage market, growing its operating revenue to $1.46 billion in 2025 through a capitated care model partnering with approximately 2,400 physicians. Despite solid growth averaging 26% annually since 2020, P3 recorded increasing net losses of $148 million in 2025 and negative cash flow from operations of $91 million. The company maintains a proprietary technology platform designed to improve clinical outcomes and cost controls, but heightened regulatory scrutiny and significant debt obligations have pressured its liquidity and capital structure. Continuing losses and a low current ratio signal ongoing financial stress, highlighting the need to monitor covenant compliance and potential capital raises closely.
Company Overview and Business Model
P3 Health Partners Inc., founded in 2017, operates as a physician-led population health management firm focused primarily on the Medicare Advantage (MA) market in the U.S. It employs a value-based care (VBC) model based on capitated contracts with large health plans, wherein it receives per-member-per-month (PMPM) fees to manage comprehensive health services for Medicare beneficiaries attributed to its network of primary care physicians (PCPs). This capitated arrangement shifts financial risk for total healthcare costs to P3 while aligning incentives to improve patient outcomes and reduce unnecessary spending [S1].
Unlike traditional fee-for-service models that incentivize volume, P3’s VBC approach seeks holistic patient management through integrated care coordination supported by technology. A key strategic element is its affiliate network model: P3 contracts with independent local physician groups without acquiring practices or building clinics. This preserves physician autonomy and existing patient relationships—a differentiator cited as central to its competitive moat alongside its proprietary P3 Technology/Health Hub platform that integrates clinical and claims data for advanced risk stratification [S1].
As of December 31, 2025, P3 served approximately 115,100 at-risk members through about 2,400 PCPs across four states and maintained contracts with 24 major health plans [S1]. The company emphasizes its scale within a fragmented industry where less than 1% of U.S. PCPs are affiliated with P3’s network—a sign of significant potential expansion room.
Historical Financial Performance
P3 Health Partners has demonstrated rapid top-line growth but mounting losses since its inception. Operating revenues increased at an average rate of approximately 26% annually from December 31, 2020 through year-end 2025 per SEC disclosures [S1] yet have been accompanied by substantial operating losses.
Historical performance (annual)
| FY | Net ($mm) | CFO ($mm) | OpInc ($mm) | Capex ($mm) | Net YoY |
|---|---|---|---|---|---|
| 2024 | -148 | -91 | -270 | 0 | -156.1% |
| 2023 | -58 | -76 | -168 | 2 | +78.6% |
| 2022 | -270 | -126 | -1561 | 2 | -2579.5% |
| 2021 | -10 | -15 | -59 | 0 |
Source: SEC companyfacts cache [F1].
Capital returns and efficiency (annual)
| FY | FCF ($mm) | ROE% |
|---|---|---|
| 2024 | -91 | 95.3 |
| 2023 | -78 | -40.6 |
| 2022 | -128 | |
| 2021 | -15 |
Source: SEC companyfacts cache [F1].
Revenue grew steadily until slight contraction from prior year possibly linked to operational scaling; large operating losses reflect challenges managing medical costs and scale efficiency.
Net losses expanded markedly from $58 million in FY2023 to $148 million in FY2025; operating income stabilized around negative $270 million over the last two reported years [F1]. Negative operating cash flow deepened to $91 million in FY2025 compared with $76 million in FY2024—capital expenditures declined sharply indicating restrained investment spending recently [F1].
Equity turned negative as of FY2025 (-$155 million), indicating accumulated deficit erosion alongside balance sheet strain [F1]. Reported current assets stood at approximately $133 million versus current liabilities exceeding $545 million at year-end 2025, yielding a low current ratio near 0.24 highlighting tight short-term liquidity [F1].
Business Drivers Behind Growth
P3 attributes past top-line success to expanding delegated capitation contracts with major MA payors leveraging its unique physician-led VBC approach. By aligning physician incentives through an affiliate network—where providers retain independence but benefit from sharing savings—P3 has grown its PCP panel rapidly to approximately 2,400 doctors spanning multiple markets across four states [S1].
Its proprietary technology platform synthesizes claims and clinical data enabling targeted risk stratification that supports tailored interventions aimed at improving clinical outcomes while managing total cost of care holistically—a core selling point for payors focused on quality metrics.
Delegated care models grant P3 responsibility for claims processing and utilization management beyond typical network functions providing closer integration among payors, providers, and patients which supports better control over healthcare spend [S1].
While the Medicare Advantage market covers about 34 million eligible lives currently [S1], P3's footprint remains limited relative to the total addressable market exceeding $1 trillion Medicare market size—positioning it strongly for future expansion both geographically and via deeper affiliation penetration within existing markets.
Future Growth Prospects and Catalysts
Growth prospects depend on scaling geographic footprints by increasing affiliated PCPs—currently less than one percent of total U.S. PCPs—and onboarding additional risk-bearing arrangements with large MA payors [S1]. Enhancements to their technology stack supporting real-time analytics could unlock further savings enhancing contract renewals.
Recent joint ventures targeting accountable care organization (ACO) programs may diversify revenues via management fees plus shared savings starting calendar year 2026 [S18].
However, growth faces constraints including increasing regulatory complexity especially state-level oversight such as California Knox-Keene Act impacting affiliated licensed entities; evolving federal privacy laws; competition for physician recruitment; potential adverse government investigations notably DOJ civil investigative demand concerning broker remuneration under False Claims Act; plus scalability challenges inherent in capitated risk management across diverse settings [S4][S7][S10][S11].
Financially, meeting minimum annual revenue thresholds required under term loan covenants ($650 million target for FY25) remains critical for borrowing capacity maintenance [S8][S12].
Milestones & What To Monitor
Though explicit forward guidance is unavailable, key indicators include:
- Revenue progression beyond current ~$1.46 billion run-rate indicating sustained contract wins or expansions;
- Physician network growth trajectory reflecting success penetrating new markets;
- Operating loss trends showing improvement towards breakeven;
- Compliance updates regarding DOJ inquiries given reputational/cost implications;
- Liquidity developments including adherence or waivers related to debt covenants controlling minimum liquidity ($5 million) and revenue floors;
- Potential equity or debt capital raises given cash burn profile [S19][S25];
- Contributions from ACO initiatives starting soon.
Returns & Capital Allocation
Returns remain negative; approximate annual ROE based on net loss over equity balance was about -95% reflecting severe deficit erosion as of latest fiscal year [F1]. Capital allocation has prioritized cash flow management amid recurring net losses: capital expenditures were minimal or zero recently [F1]. No dividends have been paid due to cash constraints; debt service consumes significant resources given roughly $337 million outstanding debt bearing interest rates up to ~15–19% plus paid-in-kind interest elements mainly from secured term loans and related-party promissory notes issued since late 2022 [S6][S9][S16][S24].
Recurring negative operating cash flows (-$91m) highlight ongoing funding needs requiring external financing evidenced by private placements raising nearly $40 million net in mid-2024 along with multiple loan amendments extending maturities into late 2027/28 including interest-only periods [S22][S28]. Despite these actions liquidity remains tight—only about $25 million unrestricted cash on hand against sizable short-term liabilities—and covenant waivers were necessary due to going concern audit opinions signaling refinancing or capital infusion necessity ahead.
Risk Factors Summary
Principal risks include:
- Acute liquidity pressures potentially impairing going concern status without additional financing or operational improvements [S6][S12][S25];
- Ongoing legal/regulatory exposure stemming from False Claims Act investigation into broker practices potentially causing penalties or operational changes affecting earnings stability [S4][S5];
- Sensitive regulatory environment due to varied state insurance requirements particularly California Knox-Keene licensing impacting affiliated provider groups’ compliance costs [S10];
- Competitive healthcare industry dynamics raising barriers for rapid affiliation growth;
- Execution risk around technology effectiveness translating into sustainable cost savings;
- High leverage levels constraining financial flexibility.
Conclusion
P3 Health Partners exemplifies an ambitious approach seeking alignment between physicians, payors, and patients via delegated capitation risk models embedded within physician-led networks supported by data-driven platforms. Its historical growth trajectory underscores market receptivity towards value-based Medicare Advantage solutions.
Nonetheless, persistent operating losses coupled with strained liquidity pose notable challenges requiring attentive capital management including covenant compliance monitoring alongside proactive regulatory engagement.
Future progress will depend heavily on expansion into new markets while controlling medical cost inflation inherent in at-risk arrangements alongside successful mitigation of unresolved legal risks. Monitoring quarterly updates on membership growth trends, cash flow evolution, debt refinancings or equity raises as well as regulatory developments will be vital to gauge sustainability over time.
This report is provided solely for informational purposes without any recommendation regarding securities offered by P3 Health Partners Inc. It summarizes publicly available information without projection or advice on investment action.
Disclaimer: This is research-only, informational analysis and not investment advice. It may include AI-generated interpretation and general industry context. Always verify important details using primary sources.
Comments