
Plug Power’s Revenue Growth and Investment Challenges Outline Its Path Forward
Plug Power expands its hydrogen technology footprint with growing revenues but faces ongoing losses and capital intensity.
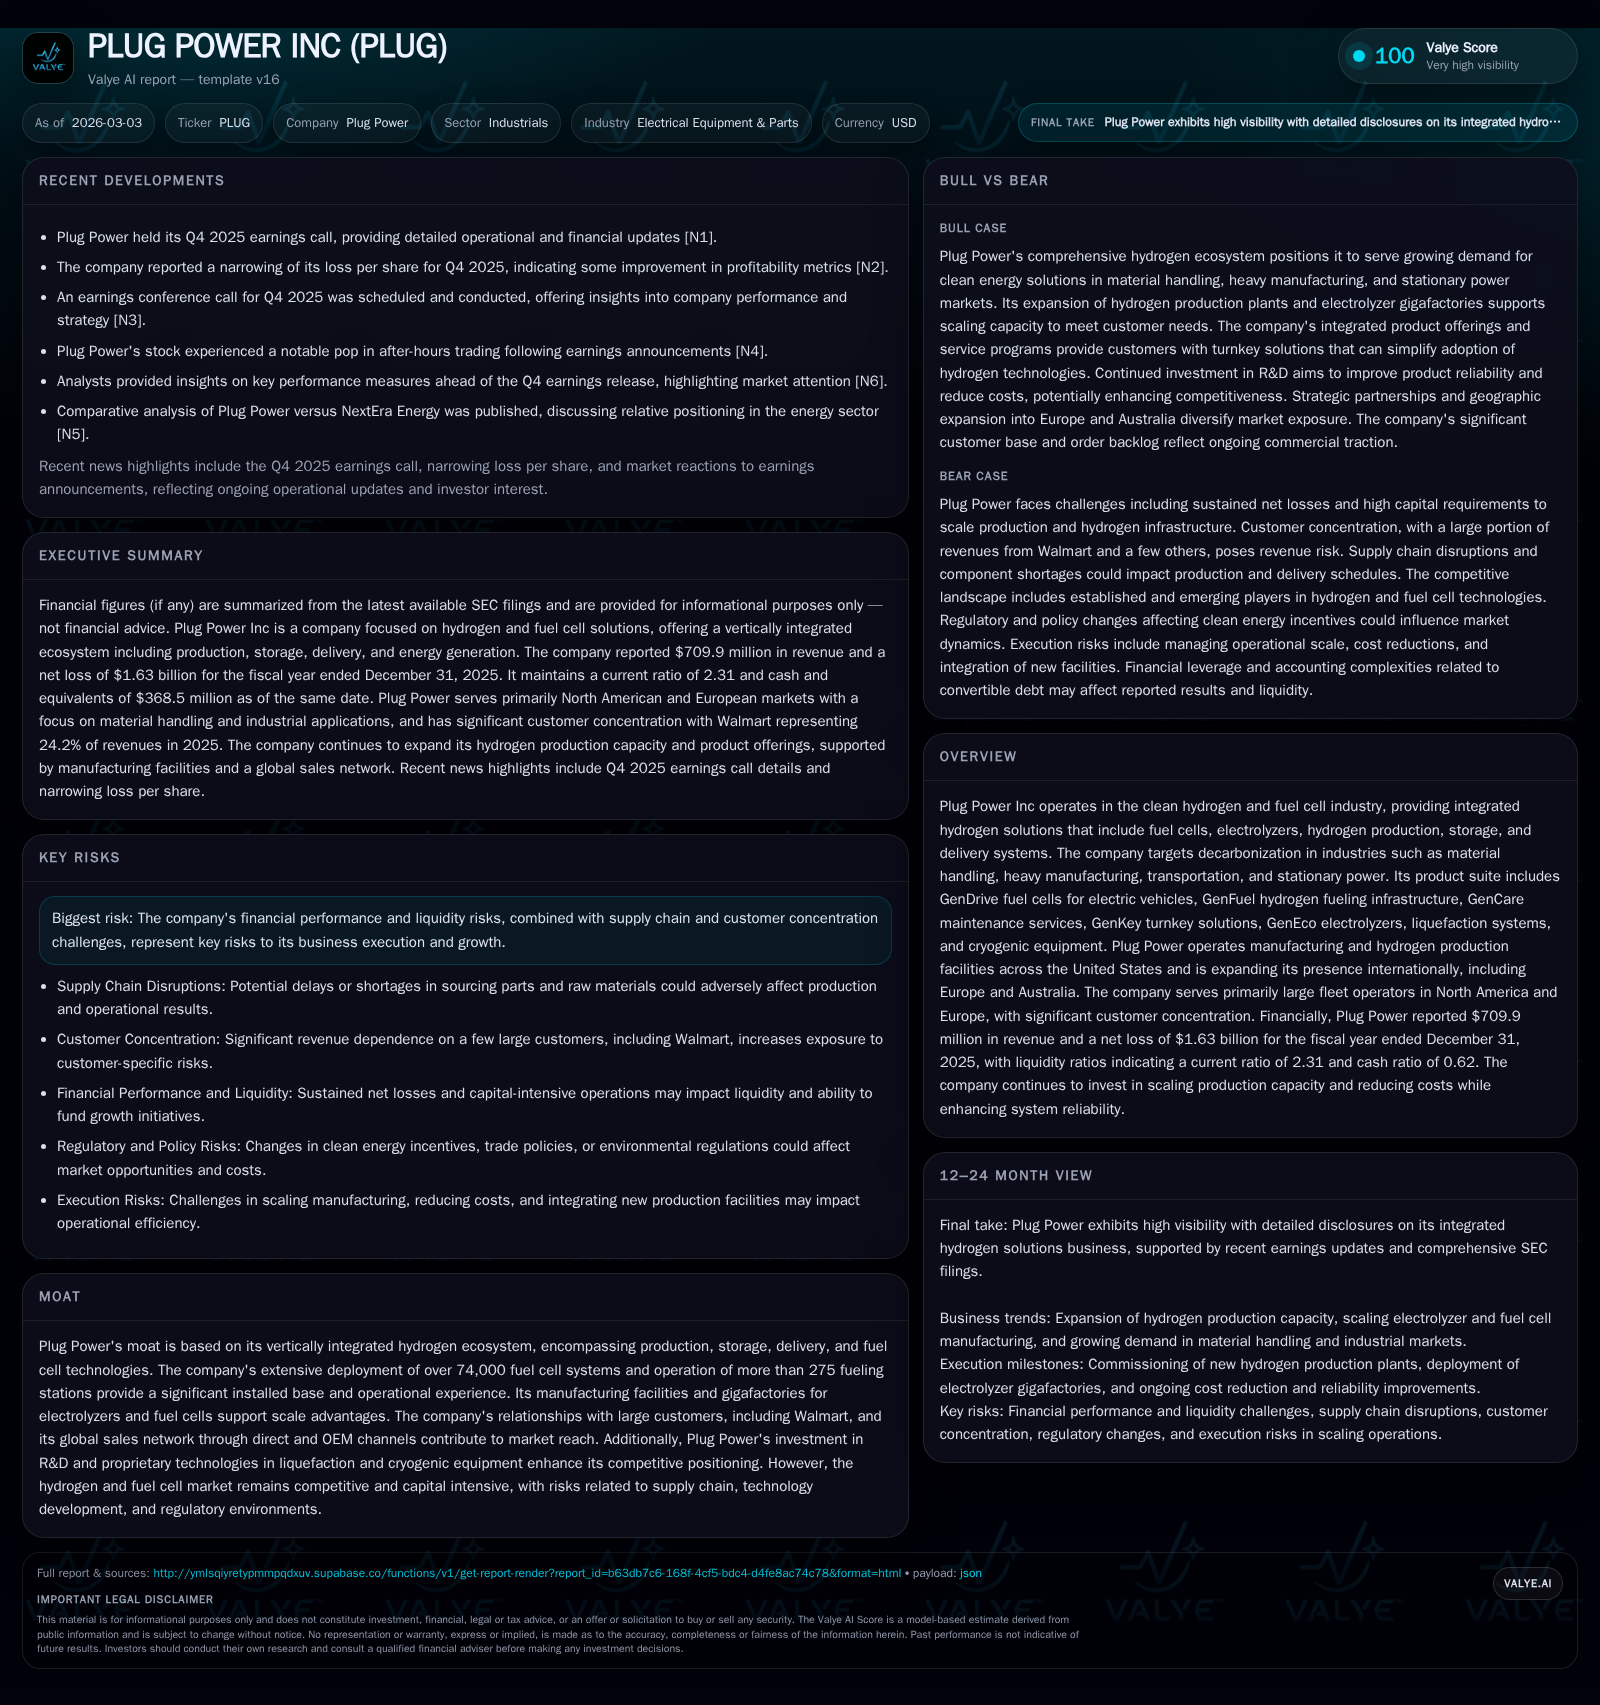
Plug Power Inc continues to establish itself as a leader in the clean hydrogen ecosystem, with a vertically integrated portfolio spanning fuel cells, electrolyzers, and hydrogen infrastructure. From 2022 to 2025, revenue increased notably by 12.9% in 2025 despite volatile trends earlier, yet operating and net losses remain substantial. The company’s strategic investments in electrolyzer gigafactories and international expansion aim to diversify customer concentration and scale production, although high capital expenditures and negative free cash flow reflect persistent financial challenges. Key risks include supply chain constraints, customer dependence on Walmart, and regulatory uncertainties, marking critical areas for monitoring in upcoming periods.
Growth Trajectory: Revenue Gains Amid Operating Losses
Historical performance (annual)
| FY | Rev ($mm) | Net ($bn) | CFO ($mm) | OpInc ($bn) | Rev YoY | Net YoY |
|---|---|---|---|---|---|---|
| 2025 | 710 | -1.6 | -536 | -1.5 | +12.9% | +22.5% |
| 2024 | 629 | -2.1 | -729 | -2.0 | -29.5% | -53.8% |
| 2023 | 891 | -1.4 | -1107 | -1.3 | +27.1% | -89.1% |
| 2022 | 701 | -0.7 | -829 | -0.7 |
Source: SEC companyfacts cache [F1].
Capital returns and efficiency (annual)
| FY | FCF ($mm) | ROE% |
|---|---|---|
| 2025 | -647 | -166.8 |
| 2024 | -1016 | -121.4 |
| 2023 | -1772 | -47.2 |
| 2022 | -1265 | -17.8 |
Source: SEC companyfacts cache [F1].
Plug Power has exhibited a mixed historical revenue pattern from fiscal years 2022 through 2025. After posting $701 million in revenue in FY2022, the company saw a significant surge to $891 million in FY2023 before a considerable drop back to $629 million in FY2024. The latest full fiscal year data for 2025 highlights a recovery to nearly $710 million—reflecting a solid 12.9% year-over-year increase against FY2024 [F1]. This rebound evidences some stabilization amid fluctuating demand dynamics.
However, revenue growth contrasts starkly with persistent operating losses that remain deep despite YoY amelioration trends. The FY2025 operating income loss shrank by about 27.4% versus the previous year but still lingered at an extraordinary deficit of approximately -$1.47 billion [F1]. Net losses also declined from their peak but held at around -$1.63 billion in FY2025, indicating ongoing challenges translating top-line gains into profitability [F1].
Margins remain under pressure due to factors including heavy investment spend, scale-up inefficiencies during technology commercialization phases, and cost absorption ahead of anticipated volume leverage.
Integrated Hydrogen Ecosystem: Competitive Moat and Market Position
Plug Power's competitive moat is anchored in its extensive vertical integration across the hydrogen value chain—a rare feature among peers within the cleantech industrials sector. This includes proprietary GenDrive fuel cell systems tailored for electric material handling vehicles such as forklifts and automated guided vehicles (AGVs), alongside GenFuel infrastructure delivering liquid hydrogen fueling solutions [S4; S6; S7].
Moreover, Plug operates manufacturing facilities spanning New York (Slingerlands and Rochester), Texas (Houston), and Indiana (Lafayette), coupled with hydrogen production plants strategically located in Tennessee (Charleston), Georgia (Kingsland), and Louisiana (St. Gabriel) which bolster regional supply resiliency [S4].
Supporting these physical assets are Plug’s electrolyzer programs targeting megawatt-scale deployments designed to enable customers’ on-site green hydrogen generation—critical for sectors like steel-making, cement production, and logistics fleets where decarbonization is challenging through direct electrification alone [S6]. The company’s investment in gigafactories amplifies scale advantages essential for cost reductions in PEM electrolyzer cells and fuel cell stacks.
The customer base is notably concentrated; Walmart alone represented roughly 24% of consolidated revenues in FY2025 (including a $29 million warrant charge) followed closely by another major client accounting for over 14% [S15]. While this underscores strong partnerships often leveraged via OEM channel relationships, it also heightens exposure to contract renewals and pricing pressures.
Drivers Behind 2025 Financial Performance Improvements
According to insights from the Q4/2025 earnings call and SEC filings, Plug cites several operational levers behind narrowing losses per share and improved operating cash flows [N1; N10; F1; S1]. Key factors include:
- Improved cost control initiatives reducing overhead expenses as part of restructuring plans executed over recent years.
- Increased operational leverage achieved via ramping utilization at existing electrolyzer gigafactories driving better fixed cost absorption.
- A favorable product mix shift with higher-margin services like maintenance (GenCare) and turnkey solutions (GenKey) gaining traction.
Despite these positive signs, free cash flow remained negative by over $640 million due largely to continued significant investment needs in plant expansions and new technology development programs restricting near-term liquidity turnaround [F1].
Strategic Expansion and Product Innovation Outlook
Strategic growth initiatives are evident through Plug Power's international ambitions focused on Europe and Australia where hydrogen economies are gaining policy support—including emerging multi-megawatt electrolyzer projects across Portugal and other geographies enhancing market footprint beyond the core North American base [S6; N8].
Technological innovation persists around hydrogen liquefaction systems and cryogenic equipment that support storage density improvements critical for long-distance transport logistics and supply consistency—a recognized bottleneck within green hydrogen deployment pathways.
These efforts simultaneously address the risk posed by existing customer concentration by broadening adoption into new industrial mobility segments—such as heavy manufacturing applications involving steel or chemical producers—and into stationary power markets where fuel cell combined heat-and-power solutions offer differentiated benefits.
Capital expenditure patterns reflect alignment with these strategic aims but underscore tight financial balancing acts faced by management amidst ambitious scale-up schedules.
Capital Allocation Realities: Elevated Capex and Liquidity Considerations
Capital expenditure outlays contracted sharply by about 61.3% year-over-year from roughly $287 million in FY2024 down to $111 million in FY2025 as Plug appears to optimize certain prior build projects while advancing select new investments prudently [F1].
Nevertheless, this level remains substantial relative to operating cash inflows which continue to be insufficient to self-fund growth initiatives fully—with operating CFO still negative at around -$536 million for FY2025 showing improvement but no positive inflection yet achieved [F1].
Current liquidity indicators provide some comfort: total cash & equivalents of approximately $369 million paired with current assets amounting to $1.41 billion versus current liabilities near $610 million yield a current ratio of roughly 2.31—a short-term cushion enabling ongoing operations while seeking financing support if needed [F1; S8; S9].
Long-term debt features convertible notes alongside secured debentures carrying moderate interest rates adding fixed obligations that management must carefully service amid profitability challenges [S14]. No recent equity raises were publicly detailed though capital markets access remains essential given sector capital intensity.
Return Metrics and Shareholder Returns: A Long Road Ahead
The persistence of significant net losses has resulted in an approximate return on equity (ROE) near negative -166.8% as of FY2025 demonstrating ongoing erosion of shareholder capital amid reinvestment into early-stage infrastructure scaling rather than distributable earnings generation [F1].
Correspondingly, no dividends have been declared or stock buybacks executed since at least FY2018 indicating a clear focus on deploying available resources toward expanding operational capacity rather than returning capital directly to shareholders thus far.
Shareholders therefore face exposure calibrated more towards potential future equity appreciation stemming from maturing business lines rather than current income returns—a characteristic typical within cleantech transition companies navigating commercialization inflection points.
Risk Factors Impacting Future Execution
Several material risks constrain Plug Power’s outlook:
- Customer concentration risks highlighted by Walmart’s sizable revenue share could impact results materially upon contract changes or demand shifts [S15].
- Supply chain challenges persist especially regarding critical components for fuel cell stacks and electrolyzers amid global semiconductor shortages and raw material inflation pressures affecting costs and delivery timelines [S12].
- Regulatory landscapes governing hydrogen production incentives or emissions standards remain fluid across jurisdictions potentially altering economic viability assumptions underlying certain projects [S5].
- Technology execution risks exist involving scaling complex systems like multi-megawatt PEM electrolyzers or cryogenic liquefiers reliably while maintaining product performance standards required by demanding industrial clients.
- Leadership transitions announced recently may introduce short-term disruption risks as new executives steer strategy adjustments under uncertain macro conditions [S12].
Successful navigation of these intertwined headwinds will shape Plug’s ability to sustain growth momentum towards breakeven horizons without undue capital dilution or operational interruptions.
Monitor Points: What To Watch In Upcoming Earnings And Developments
Market watchers should track several pivotal developments going forward:
- Progress on increased throughput levels at existing electrolyzer gigafactories supporting margin improvements via built-in operating leverage effects.
- Evolution of international sales channels particularly deployments across Europe/Australia underpinning diversification beyond North America dominance.
- Discipline around capex commitments reflecting tighter budgeting aligned with cash flow realities balanced against strategic growth imperatives.
- Near-term shifts in customer contract mix focusing on expansion outside large single customers mitigating concentration exposure risks.
- Any announcements regarding partnerships or governmental agreements providing funding or loan facilities fostering more affordable capital access appear critical given current financing constraints.
- Continued narrowing of per-share loss metrics affirming operational improvements from restructuring initiatives reported during Q4/25 earnings discussions [N1; N10; S3].
These indicators collectively define a path-dependent scenario where successful conversion of scale advantages into stable positive cash flows will mark key transition milestones for the company’s sustainable evolution within the burgeoning clean hydrogen economy.
This analysis synthesizes publicly available data including SEC filings ([F1], [S#]) and recent earnings call transcripts ([N#]) without offering investment recommendations or price forecasts. Risks inherent to developing technologies and market dynamics necessitate prudent consideration when evaluating company prospects.
Disclaimer: This is research-only, informational analysis and not investment advice. It may include AI-generated interpretation and general industry context. Always verify important details using primary sources.
Comments