
PPG Industries Confronts Margin Pressure Despite Robust Sales Growth in Specialty Coatings
PPG’s Q2 2026 results highlight sustained sales momentum alongside profitability challenges amid raw material inflation and evolving product mix.
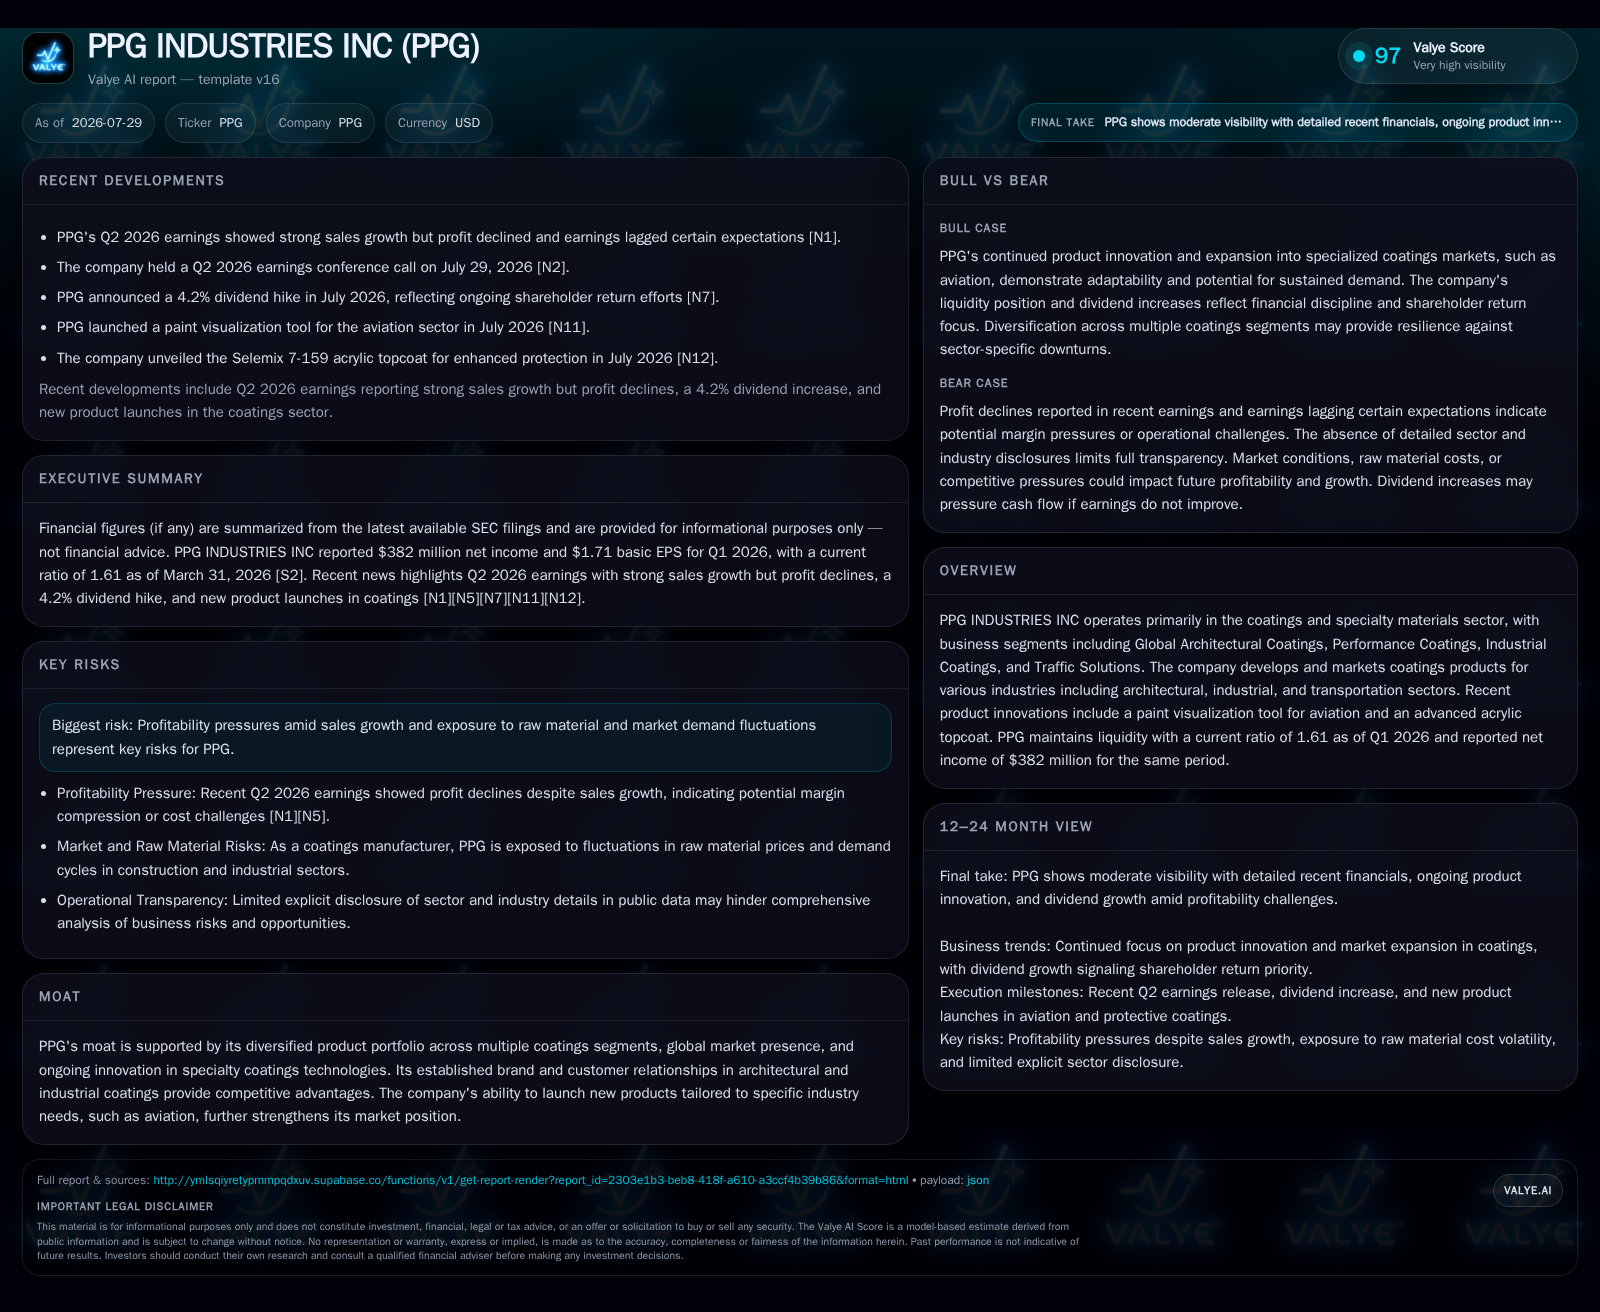
In its latest quarterly filing for Q2 2026, PPG Industries posted strong sales growth driven by diversified end markets including architectural, industrial, and transportation coatings. However, net income declined slightly compared to prior periods, reflecting margin compression largely from inflationary raw material costs and elevated operating expenses. PPG’s innovation efforts, such as a new aviation paint visualization tool and advanced acrylic topcoats, underline its strategic focus on specialty coatings with increasing sustainability attributes. Near-term risks include raw material volatility and demand cyclicality across end markets, while the balance sheet remains robust with a current ratio of 1.61 and manageable leverage ratios. Ongoing R&D investment and capacity management will be critical indicators of PPG’s ability to sustain competitive advantage amid market pressures.
Latest Operating Update: Q2 2026 Results Reflect Mixed Profitability Amid Topline Strength
PPG Industries’ Q2 2026 results, as reported in its July 29, 2026 Form 10-Q filing [S2], demonstrate robust sales growth across its diversified coatings portfolio but reveal ongoing margin pressures. Net sales advanced notably across the Global Architectural Coatings, Performance Coatings, Industrial Coatings, and Traffic Solutions segments, driven by volume gains in architectural coatings fueled by construction recovery and increased demand in automotive aftermarket channels. Despite this top-line momentum, net income declined modestly to $382 million in Q2 2026 [N1][S2], reflecting compression in gross and operating margins primarily due to elevated raw material costs.
Raw material inflation, particularly in titanium dioxide and petroleum-based organics—key feedstocks in PPG’s coating formulations—remained a significant headwind, increasing production costs and limiting margin expansion despite selective price increases implemented across various geographies [S1]. The company also incurred restructuring charges related to operational consolidations and headcount reductions, though these expenses are tapering as initiatives approach completion through 2026-27 [S25]. Currency translation effects further contributed to earnings variability given PPG’s extensive global operations.
Innovation continues to be a strategic priority, with recent product launches aimed at strengthening PPG’s specialty coatings differentiation. The introduction of a paint visualization tool for the aviation sector enables OEM and aftermarket customers to digitally prototype and customize paint schemes, enhancing customer engagement and potentially accelerating order conversion in aerospace coatings [N12]. Additionally, the Selemix 7-159 acrylic topcoat offers improved durability and environmental compliance benefits for transportation coatings customers, supporting premium pricing in a competitive segment [N14]. These innovations align with PPG’s focus on specialty formulations that integrate sustainability and performance advantages.
Business Model: Diversified Specialty Coatings Offering Anchored on Innovation and Scale
PPG operates as a global manufacturer and marketer of formulated chemical products including paints, coatings, adhesives, sealants, metal pretreatments, optical monomers, and specialty materials [S1]. Revenue generation is primarily through sales of these products either directly to original equipment manufacturers (OEMs), industrial fabricators, commercial contractors, and transportation sector clients, or indirectly via distributors and retail channels serving professional applicators and do-it-yourself (DIY) consumers.
Monetization drivers include sales volume (measured in gallons or tons of coatings sold), average selling price per unit influenced by product mix shifts toward higher-margin specialty coatings, and geographic expansion targeting emerging markets with growing infrastructure and manufacturing activity. Continuous innovation in waterborne and powder coating formulations, low-VOC technologies, and curing processes supports product differentiation and regulatory compliance.
PPG’s key product segments are:
- Global Architectural Coatings: High-volume decorative paints distributed through retail networks to professional contractors and DIY consumers worldwide.
- Performance Coatings: Specialized coatings tailored for industrial applications, including automotive refinish markets where rapid curing and color matching are critical.
- Industrial Coatings: Custom coatings supplied directly to OEMs in automotive assembly, aerospace manufacturing, packaging (metal cans and tubes), and other heavy industries.
- Traffic Solutions: Pavement marking and maintenance products serving municipal infrastructure needs.
The company leverages centralized research and development centers to drive innovation efficiency, complemented by regional development hubs that tailor formulations to local market requirements and environmental regulations [S20]. Its distribution model balances direct sales for large OEM contracts with broad retail availability for architectural coatings, enabling diversified customer reach.
Industry Structure and Competitive Positioning: Navigating Commodity Sensitivity Within a Consolidated Landscape
PPG operates within the specialty chemicals and coatings industry, serving diverse end markets such as construction, automotive manufacturing, aerospace, packaging, and consumer maintenance. The competitive landscape includes global leaders like Sherwin-Williams, RPM International, AkzoNobel, Axalta Coating Systems, and BASF’s coatings segment, each competing on formulation expertise, sustainability credentials, scale efficiencies, and customer service [S1][S20].
The industry is characterized by moderate concentration among multinational firms with competition centered on proprietary technologies (e.g., curing technology, antimicrobial additives), environmental compliance (low-VOC, waterborne coatings), and cost management amid raw material price volatility. PPG’s broad product portfolio spanning commodity architectural paints to premium specialty coatings provides a balanced exposure to volume-driven and margin-accretive segments.
PPG’s global footprint mitigates geographic risk but introduces currency translation volatility. Its digital initiatives, such as the aviation paint visualization tool, enhance customer engagement and differentiate it from peers relying more heavily on traditional product offerings.
Growth Drivers: Innovation-Led Expansion Coupled With Emerging Market Penetration
PPG identifies several structural growth catalysts [S1]:
- Increasing demand for sustainable coatings with reduced hazardous emissions driven by tightening global air quality regulations.
- Expansion of emerging markets construction and infrastructure projects supporting volume growth in architectural coatings and traffic solutions.
- Growth in automotive and aerospace manufacturing fueling demand for industrial coatings, including lightweight sealants and antimicrobial surface treatments.
- Replacement and maintenance cycles in transportation fleets driving aftermarket coatings consumption.
- Introduction of high-performance coating systems incorporating advanced curing technologies enhancing product performance and customer retention.
- Strategic digital tools improving customer customization and order conversion rates.
Acquisitions aimed at geographic expansion or technology enhancement complement organic innovation, though integration risks remain a monitoring point [S23].
Risks and Watchpoints: Margin Pressures Amid Input Cost Fluctuations and Demand Cyclicality
Key risks include raw material cost volatility, especially in titanium dioxide and petroleum derivatives, which can compress margins if price pass-through is limited by competitive pressures or contract terms [S1][N8]. Demand cyclicality affects performance and industrial coatings segments exposed to automotive OEM production and construction activity fluctuations [S26].
Regulatory changes may increase compliance costs and capital expenditures related to reformulating products to meet environmental standards [S26]. Competitive pricing pressures in commoditized product lines could erode margins if differentiation weakens. Supply chain disruptions in raw materials or logistics remain potential hazards.
Technological obsolescence risk exists if competitors advance low-temperature curing or antimicrobial technologies faster than PPG [S1]. Currency exchange rate fluctuations impact earnings given PPG’s global operations [S2][S18]. Additionally, new environmental credit accounting standards effective in 2028 may affect financial reporting comparability and require close monitoring [S22].
What to Watch Next: Margin Recovery Trajectory and Innovation Adoption Metrics
Upcoming quarterly reports will be critical to assess margin stabilization as PPG manages raw material inflation through pricing and cost control. The pace of decline in restructuring expenses will influence operating leverage improvements [S25]. Adoption rates of new specialty products like the Selemix 7-159 acrylic topcoat and aviation paint visualization tool will serve as indicators of innovation success and potential margin enhancement.
Geographic sales trends, particularly growth in emerging markets versus mature economies, will provide insight into demand resilience [N10][N13]. Updates on regulatory compliance costs and environmental credit accounting impacts starting in 2028 should be monitored alongside R&D expenditure levels to gauge sustained competitive positioning without undue margin pressure. Capital allocation decisions regarding dividends and share repurchases will also reflect management’s confidence amid macroeconomic uncertainties.
Financial Profile Discussion
As of March 31, 2026, PPG reported cash and cash equivalents of approximately $1.573 billion, with current assets totaling $7.97 billion against current liabilities of $4.953 billion, resulting in a healthy current ratio of 1.61, underscoring solid near-term liquidity [F1][S2]. The company maintains a net cash position, with estimated net debt around negative $573 million, reflecting balance sheet flexibility despite recent euro- and Swiss franc-denominated bond issuances aimed at diversifying debt maturities and currency exposure [S23][S18].
Leverage metrics remain conservative, with total indebtedness to total capitalization ratios comfortably below covenant limits at mid-40% levels, providing strategic financial headroom for acquisitions or capital return initiatives [S18][S23].
This analysis integrates data from PPG Industries’ latest quarterly and event filings dated July 29, 2026 [S2][S3], supplemented by the 2026 annual report [S1] and relevant market commentary [N1][N12][N14]. Financial metrics are strictly drawn from SEC filings and companyfacts [F1]. Industry context reflects standard specialty chemicals and coatings sector dynamics without speculative assertions.
Disclaimer: This is an informational analysis based on publicly available data and does not constitute investment advice. Readers should verify details with primary sources.
Disclaimer: This is research-only, informational analysis and not investment advice. It may include AI-generated interpretation and general industry context. Always verify important details using primary sources.

Comments