
United Parks & Resorts Faces Financial Headwinds as Growth Slows
The company’s iconic brand portfolio contends with weakening earnings, operational labor constraints, and high leverage amid a challenging leisure market.
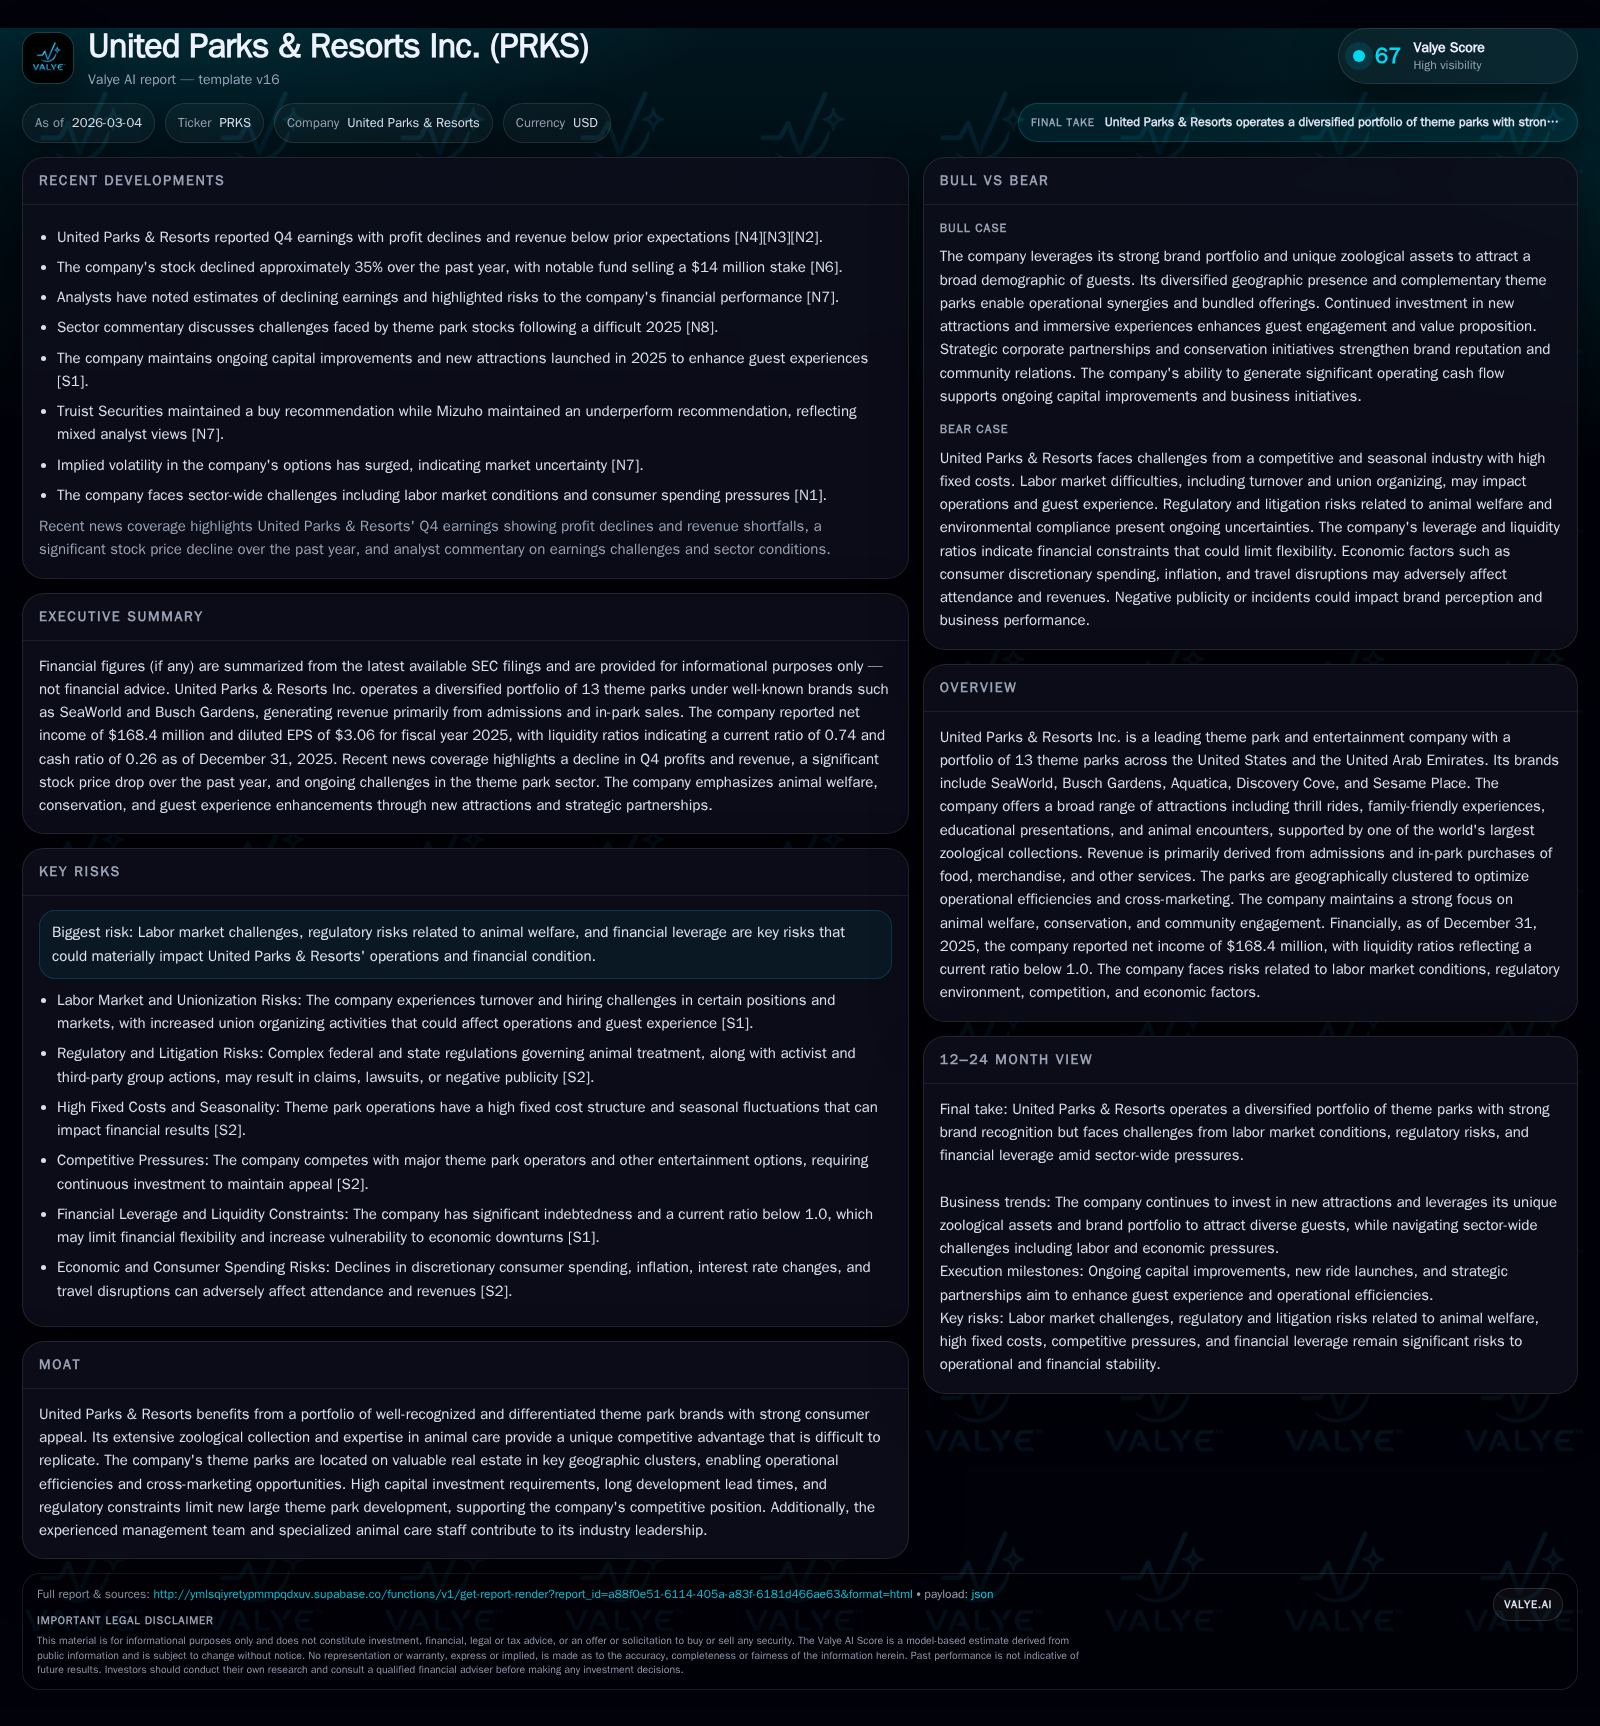
United Parks & Resorts Inc., owner of prominent theme park brands including SeaWorld and Busch Gardens, reported decelerating financial performance in fiscal 2025 with revenue slightly down and operating income dropping notably. Operational headwinds from tight labor markets and animal welfare regulatory complexities are straining the parks’ guest experience and cost structure. The company carries significant leverage around $2.25 billion, limiting financial flexibility and pressuring capital allocation decisions amid softened consumer discretionary spending. While the brand moat remains intact, returns have declined and future growth depends on navigating market uncertainties and sustaining attendance trends.
Company Snapshot: Brands and Business Model
United Parks & Resorts Inc. is a major player in the theme park industry owning or licensing a diversified portfolio of 13 parks spanning key U.S. markets and the United Arab Emirates. Their flagship brands include SeaWorld, Busch Gardens, Aquatica, Discovery Cove, and Sesame Place [S1]. These parks integrate thrill rides, family-friendly entertainment, immersive educational shows, plus extensive zoological collections — positioning PRKS uniquely as both an amusement destination and a globally recognized zoological institution devoted to animal welfare and marine rescue.
The parks’ geographic clustering optimizes operational efficiencies such as centralized management of specialized animal care teams and creates cross-promotional marketing opportunities within regional clusters [S1]. Revenue predominantly arises from admissions alongside secondary streams including food service, retail merchandise sales, and ancillary experiences within park grounds.
Maintaining one of the world's largest zoological collections underpins a competitive moat that competitors find hard to replicate due to required expertise in veterinary care, training, and animal conservation advocacy [S1]. This zoological focus also differentiates PRKS against purely fantasy- or thrill-ride oriented theme parks.
Historic Financial Performance and Key Growth Drivers
From 2017 through 2025 PRKS experienced fluctuating top-line trends with peak growth followed by recent deceleration [F1]. Annual revenue hovered near $265 million in 2017 before subtle contraction surfaced:
Historical performance (annual)
| FY | Net ($mm) | CFO ($mm) | OpInc ($mm) | Capex ($mm) | Net YoY |
|---|---|---|---|---|---|
| 2025 | 168 | 380 | 365 | 217 | -26.0% |
| 2024 | 227 | 480 | 463 | 248 | -2.9% |
| 2023 | 234 | 505 | 460 | 305 | -19.6% |
| 2022 | 291 | 565 | 508 | 201 |
Source: SEC companyfacts cache [F1].
Capital returns and efficiency (annual)
| FY | Buybacks ($mm) | FCF ($mm) | ROE% |
|---|---|---|---|
| 2025 | 160 | 163 | -38.6 |
| 2024 | 483 | 232 | -49.3 |
| 2023 | 18 | 200 | -112.5 |
| 2022 | 694 | 364 | -66.5 |
Source: SEC companyfacts cache [F1].
Recent years reveal decelerating growth driven by factors including attendance pressure amid economic softness impacting discretionary spending [F1]. Operating income notably contracted by over a fifth between FY24 and FY25 even as revenues dipped marginally by less than one percent—a signal margins compressed substantially likely from cost inflation or operational inefficiencies.
Cash flow from operations declined by nearly 21% reflecting lower profitability but remained strong in absolute terms relative to capital expenditures which shrank too—pointing to more cautious capex investment pacing [F1].
Negative equity levels worsened though due likely to accumulated deficits or goodwill write-downs raising balance sheet concerns despite stable cash generation capacity [F1].
Recent Earnings Outcomes and Revenue Trends
The Q4 fiscal 2025 earnings released in February failed to meet analyst expectations on both earnings per share and revenue fronts with notable shortfalls cited across various segments [N1][N2][N6][S3]. Attendance yields softened amidst economic headwinds reducing guest per capita spending adversely affecting in-park purchases.
Market responses were muted but indicate investor caution given continued negative revisions amid broader leisure travel sector weakness [N5][N7]. The report emphasized that while some regional parks stabilized attendance patterns post-pandemic peak declines remain apparent particularly given inflationary pressures restraining discretionary budgets.
Operational Challenges: Labor Market and Regulatory Landscape
Persistent labor shortages disrupt front-line staffing at multiple parks posing risks to guest experience continuity [S1][S2]. Elevated turnover rates driven by competitive wage demands have intensified union organizing activities — adding complexity to workforce management costs.
Simultaneously, stringent federal/state regulations governing animal treatment impose compliance burdens requiring sustained investments in veterinary facilities, training programs, and risk mitigation protocols [S2]. Activist groups continue exerting pressure via litigation threats or public campaigns escalating reputational risks.
Such overlapping workforce/animal welfare challenges elevate fixed costs thereby squeezing operational margins already pressured by subdued attendance yields.
Capital Structure, Leverage, and Credit Ratings Impact
As of December 31, 2025 United Parks carried approximately $2.25 billion in long-term debt nestled within senior secured facilities rated BB+ by S&P with Moody’s assigning Ba2—both stable outlooks [S4][S5][S6]. Interest expenses approximate $110 million annually further constraining free cash flow available for reinvestment or shareholder returns.
High leverage restricts ability to pursue opportunistic investments or buffer cyclical downturns without incurring refinancing risk. Debt covenants mandate financial ratio upkeep adding discipline but potentially limiting strategic flexibility [S9][S11][S14].
Additionally variable rate borrowings expose PRKS to potential further expense increases should interest rates rise anew beyond current elevated levels despite recent Fed easing moves [S24][S25].
Capital Allocation: Dividends, Buybacks, and Investment Priorities
The company has prioritized balance sheet repair alongside prudent reinvestment into park assets amid slowing growth signals. Share repurchases dropped sharply from $483 million in FY24 down to $160 million in FY25 evidencing more conservative capital return posture amid uncertain operating conditions [F1][S7][S8][S16].
Capital expenditures declined over the same period indicating reined-in investment commitments likely focusing on maintenance capex versus expansionary projects [F1]. Dividend distributions are not prominently noted implying either minimal payouts or reinvestment preference.
Healthy free cash flow generation (~$163 million computed from CFO less capex in FY25) provides some runway but steep negative equity highlights structural solvency concerns warranting cautious stewardship of capital resources [F1].
Outlook: Strategic Prospects and Risks Ahead
Looking forward PRKS faces a mixed landscape: prospects hinge on recovering attendance through new attractions and marketing while containing rising operating costs stemming from workforce pressures [N3][N4][N8][S1][S2]. Seasonality effects typical of the industry will demand fine-tuned yield management amid macroeconomic consumer confidence swings.
Risks extend beyond pure economics into regulatory shifts especially around animal welfare governance potentially requiring incremental investments or restrictions on exhibit configurations.
Moreover high financial leverage limits maneuverability increasing vulnerability if sector-wide leisure demand softens further.
Key indicators for watch include:
- Attendance trajectory post-2025 softness,
- Consumer discretionary spend elasticity,
- Union negotiations outcomes,
- Regulatory developments affecting zoological practices,
- Interest rate environment impacts on financing costs.
Investor sentiment likely hinges on clarity around these operational parameters against backdrop of competing giant players emphasizing product innovation.
Key Metrics Table: Revenue, Income, CFO, Capex (2017-2025)
| Fiscal Year | Revenue ($M) | Operating Income ($M) | Net Income ($M) | Operating Cash Flow ($M) | Capital Expenditures ($M) |
|---|---|---|---|---|---|
| 2017 | 265 | ||||
| 2022 | - | 508 | 291 | 565 | 201 |
| 2023 | - | 460 | 234 | 505 | 305 |
| 2024 | - | 463 | 227 | 480 | 248 |
| 2025 | - | 365 | 168 | 380 | 217 |
| FY17 marks last full year numeric base; FY22-FY25 illustrate recent trends based on available data. |
United Parks & Resorts remains anchored by venerable brands with distinct zoological attributes but confronts slowing financial momentum exacerbated by labor scarcity and regulatory complexity at a time when its capital structure restricts room for strategic discretion. Monitoring operational recovery alongside effective leverage management will be pivotal as the company seeks sustainable visitor appeal within an intensely competitive market environment.
This analysis is based on publicly available SEC filings (notably Forms 10-K/10-Q/8-K), companyfacts data sets for financials through fiscal year-end December 31, 2025 as well as relevant news articles published in early 2026.
Disclaimer: This is research-only, informational analysis and not investment advice. It may include AI-generated interpretation and general industry context. Always verify important details using primary sources.
Comments